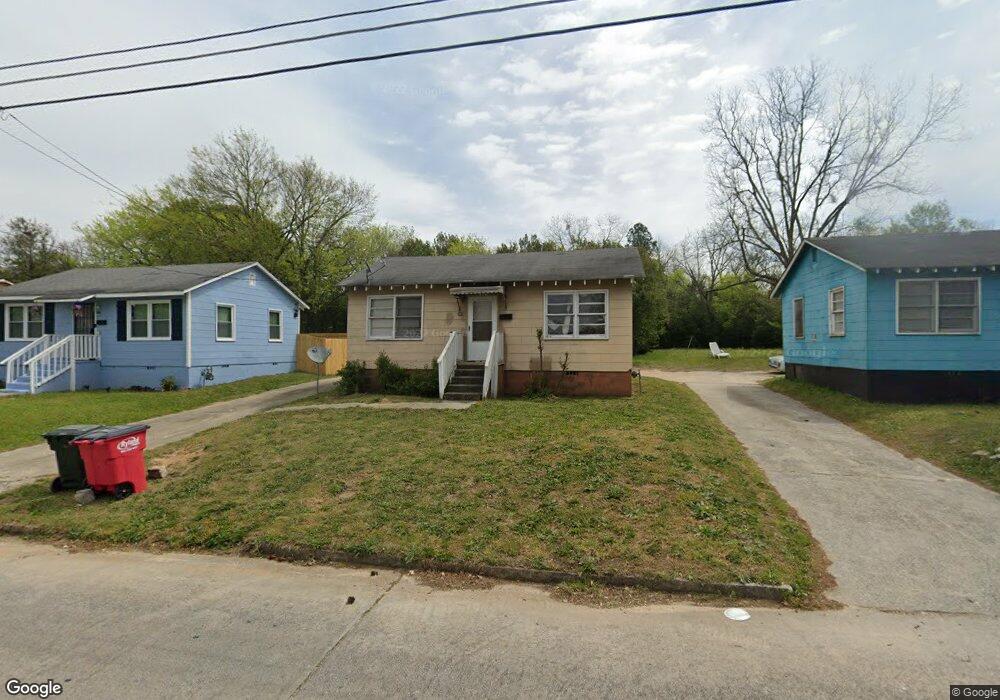
2340 Knott St Macon, GA 31201
Tindall Heights Historic District NeighborhoodEstimated Value: $42,000 - $74,458
2
Beds
1
Bath
672
Sq Ft
$82/Sq Ft
Est. Value
About This Home
This home is located at 2340 Knott St, Macon, GA 31201 and is currently estimated at $55,115, approximately $82 per square foot. 2340 Knott St is a home located in Bibb County with nearby schools including Ingram-Pye Elementary School, Central High School, and Cirrus Charter Academy.
Ownership History
Date
Name
Owned For
Owner Type
Purchase Details
Closed on
Oct 14, 2011
Sold by
Fannie Mae
Bought by
Rumph Derrick
Current Estimated Value
Purchase Details
Closed on
Sep 27, 2011
Sold by
Burrow Melvyn R
Bought by
Federal National Mortgage Association
Purchase Details
Closed on
May 3, 2011
Sold by
Burrow Melvyn R
Bought by
Onewest Bank Fsb
Purchase Details
Closed on
Nov 21, 2002
Bought by
Burrow Melvyn R
Create a Home Valuation Report for This Property
The Home Valuation Report is an in-depth analysis detailing your home's value as well as a comparison with similar homes in the area
Home Values in the Area
Average Home Value in this Area
Purchase History
| Date | Buyer | Sale Price | Title Company |
|---|---|---|---|
| Rumph Derrick | $4,200 | None Available | |
| Federal National Mortgage Association | -- | None Available | |
| Onewest Bank Fsb | $40,200 | -- | |
| Federal National Mortgage Association | $40,202 | None Available | |
| One West Bank Fsb | $40,201 | None Available | |
| Burrow Melvyn R | $35,000 | -- |
Source: Public Records
Tax History Compared to Growth
Tax History
| Year | Tax Paid | Tax Assessment Tax Assessment Total Assessment is a certain percentage of the fair market value that is determined by local assessors to be the total taxable value of land and additions on the property. | Land | Improvement |
|---|---|---|---|---|
| 2025 | $237 | $9,632 | $2,700 | $6,932 |
| 2024 | $245 | $9,632 | $2,700 | $6,932 |
| 2023 | $245 | $9,632 | $2,700 | $6,932 |
| 2022 | $250 | $7,235 | $2,130 | $5,105 |
| 2021 | $275 | $7,235 | $2,130 | $5,105 |
| 2020 | $281 | $7,235 | $2,130 | $5,105 |
| 2019 | $283 | $7,235 | $2,130 | $5,105 |
| 2018 | $614 | $7,235 | $2,130 | $5,105 |
| 2017 | $271 | $7,235 | $2,130 | $5,105 |
| 2016 | $250 | $7,235 | $2,130 | $5,105 |
| 2015 | $354 | $7,235 | $2,130 | $5,105 |
| 2014 | $407 | $7,235 | $2,130 | $5,105 |
Source: Public Records
Map
Nearby Homes