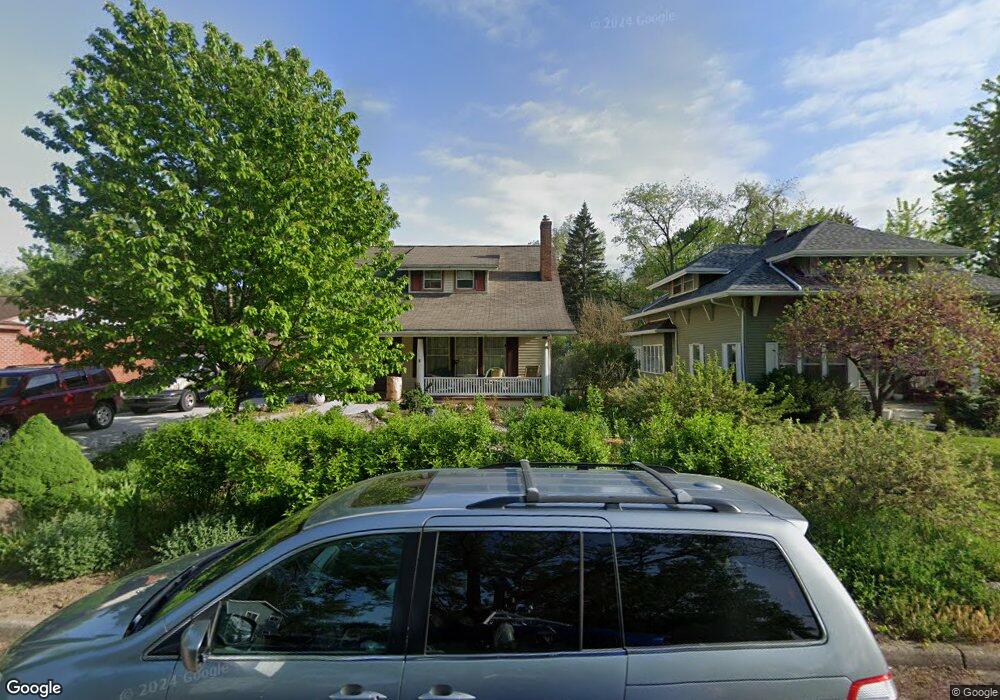
2340 Mckinley St Ypsilanti, MI 48197
Estimated Value: $184,000 - $325,000
4
Beds
2
Baths
1,350
Sq Ft
$203/Sq Ft
Est. Value
About This Home
This home is located at 2340 Mckinley St, Ypsilanti, MI 48197 and is currently estimated at $274,012, approximately $202 per square foot. 2340 Mckinley St is a home located in Washtenaw County with nearby schools including Estabrook Elementary School, Erickson Elementary School, and Holmes Elementary School.
Ownership History
Date
Name
Owned For
Owner Type
Purchase Details
Closed on
Dec 16, 2010
Sold by
Bank Of Ann Arbor
Bought by
Halliburton Linda
Current Estimated Value
Home Financials for this Owner
Home Financials are based on the most recent Mortgage that was taken out on this home.
Original Mortgage
$58,500
Outstanding Balance
$1,308
Interest Rate
4.22%
Mortgage Type
New Conventional
Estimated Equity
$272,704
Purchase Details
Closed on
Apr 30, 2009
Sold by
National Community Acquisitions Llc
Bought by
New Liberty Bank
Purchase Details
Closed on
Mar 7, 2005
Sold by
National Community Acquisitions Llc
Bought by
Gower Robin K
Home Financials for this Owner
Home Financials are based on the most recent Mortgage that was taken out on this home.
Original Mortgage
$108,800
Interest Rate
5.7%
Mortgage Type
Purchase Money Mortgage
Create a Home Valuation Report for This Property
The Home Valuation Report is an in-depth analysis detailing your home's value as well as a comparison with similar homes in the area
Home Values in the Area
Average Home Value in this Area
Purchase History
| Date | Buyer | Sale Price | Title Company |
|---|---|---|---|
| Halliburton Linda | $65,000 | Sur | |
| New Liberty Bank | $112,367 | None Available | |
| Gower Robin K | -- | Mta | |
| National Community Acquisitions Llc | $136,000 | Mta | |
| Gower Robin K | -- | Mta |
Source: Public Records
Mortgage History
| Date | Status | Borrower | Loan Amount |
|---|---|---|---|
| Open | Halliburton Linda | $58,500 | |
| Previous Owner | National Community Acquisitions Llc | $108,800 |
Source: Public Records
Tax History Compared to Growth
Tax History
| Year | Tax Paid | Tax Assessment Tax Assessment Total Assessment is a certain percentage of the fair market value that is determined by local assessors to be the total taxable value of land and additions on the property. | Land | Improvement |
|---|---|---|---|---|
| 2025 | -- | $113,200 | $0 | $0 |
| 2024 | -- | $105,900 | $0 | $0 |
| 2023 | -- | $93,200 | $0 | $0 |
| 2022 | $0 | $88,800 | $0 | $0 |
| 2021 | $2,559 | $72,700 | $0 | $0 |
| 2020 | $2,559 | $71,400 | $0 | $0 |
| 2019 | $2,559 | $65,800 | $65,800 | $0 |
| 2018 | $0 | $74,600 | $0 | $0 |
| 2017 | $2,566 | $70,200 | $0 | $0 |
| 2016 | $1,511 | $50,938 | $0 | $0 |
| 2015 | $2,377 | $50,786 | $0 | $0 |
| 2014 | $2,377 | $49,200 | $0 | $0 |
| 2013 | -- | $49,200 | $0 | $0 |
Source: Public Records
Map
Nearby Homes
- 2434 Harding Ave
- 224 N Hewitt Rd
- 259 Elmhurst Ave
- 2418 Draper Ave
- 2002 Midvale Ave
- 2017 Harding Ave
- 2180 Ellsworth Rd
- 550 Brookside St
- 1307 N Congress St
- 95 S Mansfield St
- 1221 S Congress St
- 1636 Washtenaw Ave
- 1805 S Congress St
- 1621 Whittier Rd
- 2600 Collegewood St
- 2564 Collegewood St
- 246 Kirk St
- 1133 S Congress St
- 1355 Lathers Ave
- 4139 Persimmon Dr
- 2350 Mckinley St
- 2330 Mckinley St
- 2330 Mckinley Ave
- 0 Mckinley Unit 4466635
- 0 Mckinley Unit 3205517
- 0 Mckinley Unit 543205517
- 0 Mckinley Unit 3243250
- 0 Mckinley Unit 3256004
- 0 Mckinley Unit 3255571
- 0 Mckinley Unit 3254625
- 0 Mckinley Unit 3257071
- 2362 Mckinley St
- 2320 Mckinley St
- 2329 Harding Ave
- 2345 Harding Ave
- 2307 Harding Ave
- 2372 Mckinley St
- 2357 Harding Ave
- 2335 Mckinley St
- 2372 Mckinley St