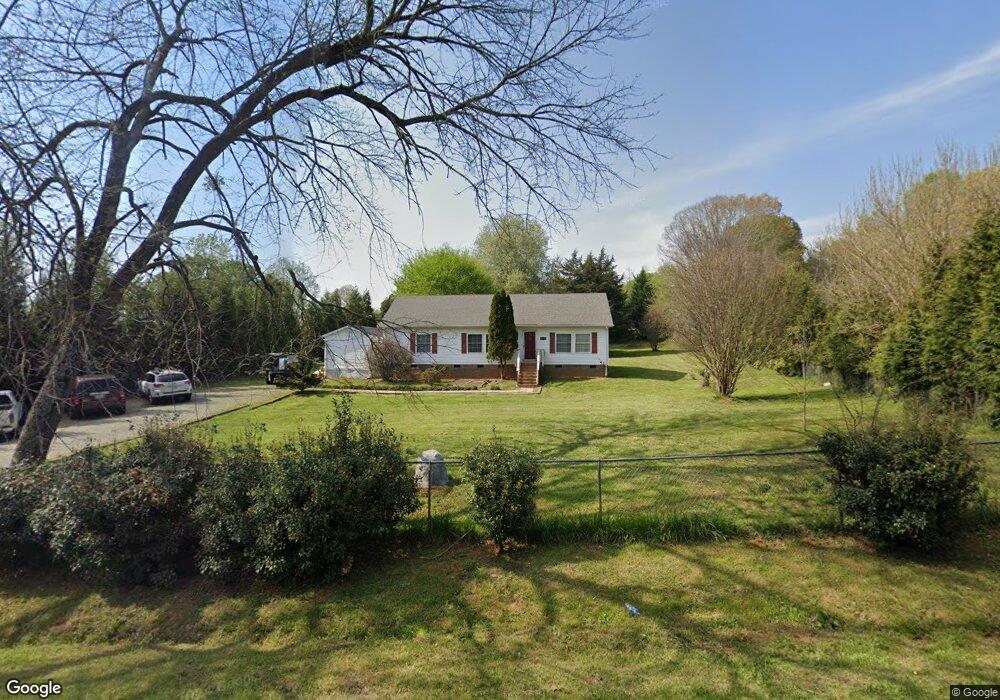
2340 Saxapahaw Bethlehem Church Rd Graham, NC 27253
Estimated Value: $188,000 - $327,000
3
Beds
2
Baths
1,440
Sq Ft
$178/Sq Ft
Est. Value
About This Home
This home is located at 2340 Saxapahaw Bethlehem Church Rd, Graham, NC 27253 and is currently estimated at $256,598, approximately $178 per square foot. 2340 Saxapahaw Bethlehem Church Rd is a home located in Alamance County with nearby schools including B. Everett Jordan Elementary School, Hawfields Middle School, and The Hawbridge School.
Ownership History
Date
Name
Owned For
Owner Type
Purchase Details
Closed on
Nov 22, 2013
Sold by
V Q M Real Estate Inv Llc
Bought by
Perez Alexander
Current Estimated Value
Home Financials for this Owner
Home Financials are based on the most recent Mortgage that was taken out on this home.
Original Mortgage
$97,206
Outstanding Balance
$71,089
Interest Rate
3.75%
Mortgage Type
FHA
Estimated Equity
$185,509
Purchase Details
Closed on
Apr 25, 2013
Sold by
Neighborhood Housing Group Llc
Bought by
V Q M Real Estate Investments
Home Financials for this Owner
Home Financials are based on the most recent Mortgage that was taken out on this home.
Original Mortgage
$50,000
Interest Rate
3.59%
Mortgage Type
New Conventional
Purchase Details
Closed on
Aug 29, 2012
Sold by
Secretary Of H U D
Bought by
Neighborhood Housing Group
Purchase Details
Closed on
Oct 25, 2011
Sold by
Tr Svcs Of Carolina Llc Sub Tr and Smith Rodney T
Bought by
Wells Fargo Bank N A
Create a Home Valuation Report for This Property
The Home Valuation Report is an in-depth analysis detailing your home's value as well as a comparison with similar homes in the area
Home Values in the Area
Average Home Value in this Area
Purchase History
| Date | Buyer | Sale Price | Title Company |
|---|---|---|---|
| Perez Alexander | $99,000 | -- | |
| V Q M Real Estate Investments | $59,000 | -- | |
| Neighborhood Housing Group | $13,000 | -- | |
| Wells Fargo Bank N A | $156,840 | -- |
Source: Public Records
Mortgage History
| Date | Status | Borrower | Loan Amount |
|---|---|---|---|
| Open | Perez Alexander | $97,206 | |
| Previous Owner | V Q M Real Estate Investments | $50,000 |
Source: Public Records
Tax History Compared to Growth
Tax History
| Year | Tax Paid | Tax Assessment Tax Assessment Total Assessment is a certain percentage of the fair market value that is determined by local assessors to be the total taxable value of land and additions on the property. | Land | Improvement |
|---|---|---|---|---|
| 2025 | $1,408 | $254,171 | $27,629 | $226,542 |
| 2024 | $1,345 | $254,171 | $27,629 | $226,542 |
| 2023 | $1,244 | $254,171 | $27,629 | $226,542 |
| 2022 | $911 | $123,789 | $27,585 | $96,204 |
| 2021 | $924 | $123,789 | $27,585 | $96,204 |
| 2020 | $857 | $113,273 | $27,585 | $85,688 |
| 2019 | $861 | $113,273 | $27,585 | $85,688 |
| 2018 | $0 | $113,273 | $27,585 | $85,688 |
| 2017 | $759 | $113,273 | $27,585 | $85,688 |
| 2016 | $843 | $125,837 | $27,585 | $98,252 |
| 2015 | $842 | $126,294 | $27,585 | $98,709 |
| 2014 | -- | $126,294 | $27,585 | $98,709 |
Source: Public Records
Map
Nearby Homes
- 2551 Saxapahaw-Bethlehem Church Rd
- 2555 Saxapahaw-Bethlehem Church Rd
- 5450 Jaeger Dr Unit Lot 42
- 5450 Jaeger Dr
- 5486 Jaeger Dr Unit Lot 37
- 5444 Jaeger Dr Unit Lot 43
- 5444 Jaeger Dr
- 5504 Jaeger Dr
- 5504 Jaeger Dr Unit Lot 76
- 5436 Jaeger Dr Unit Lot 44
- 4921 Mineral Springs Rd
- 5418 Jaeger Dr Unit Lot 46
- 4825 Mineral Springs Rd
- Seagrove Plan at Salem Woods
- Cotswold 3 Plan at Salem Woods
- Bailey Plan at Salem Woods
- Somerset 3 Plan at Salem Woods
- Richmond Plan at Salem Woods
- Cameron Plan at Salem Woods
- Midland 2 Plan at Salem Woods
- 2340 Saxapahaw Bethlehem Ch Rd
- 2340 Saxapahaw-Bethlehem Church Rd
- 2340 Saxapahaw Bethleham Ch Rd
- 2340 Saxapahaw Bethlehem Churc
- 5420 Silver Hill Ln
- 2320 Saxapahaw Bethlehem Ch Rd
- 5408 Silver Hill Ln
- 2320 Saxapahaw-Bethlehem Church Rd
- 2348 Saxapahaw Bethlehem Ch Rd
- 0 Silver Hill Ln
- 5432 Silver Hill Ln
- 5402 Silver Hill Ln
- 5472 Silver Hill Ln
- 2357 Saxapahaw Bethlehem Ch Rd
- 14 Silver Hill Ln
- Lot 14 Silver Hill Ln
- 2370 Saxapahaw Bethlehem Ch Rd
- 2370 Saxapahaw-Bethlehem Church Rd
- 5415 Silver Hill Ln
- 108 Silver Hill