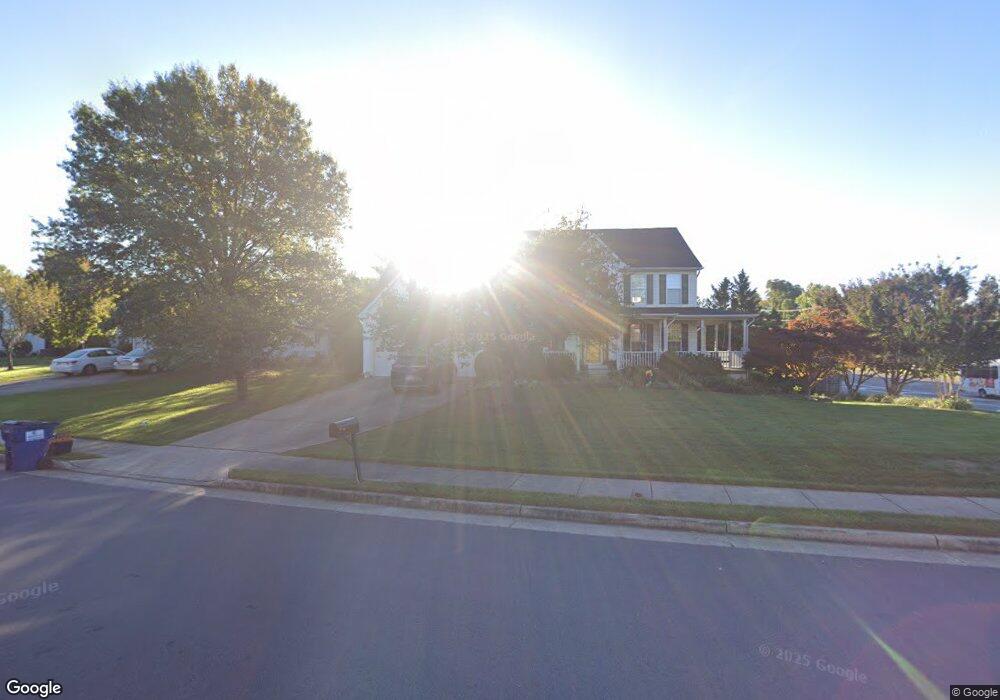
2341 Colts Brook Dr Reston, VA 20191
Estimated Value: $997,000 - $1,066,799
4
Beds
5
Baths
3,290
Sq Ft
$314/Sq Ft
Est. Value
About This Home
This home is located at 2341 Colts Brook Dr, Reston, VA 20191 and is currently estimated at $1,031,900, approximately $313 per square foot. 2341 Colts Brook Dr is a home located in Fairfax County with nearby schools including Dogwood Elementary, South Lakes High School, and Al Fatih Academy.
Ownership History
Date
Name
Owned For
Owner Type
Purchase Details
Closed on
Dec 1, 2004
Sold by
Bender John W
Bought by
Cox Terri
Current Estimated Value
Home Financials for this Owner
Home Financials are based on the most recent Mortgage that was taken out on this home.
Original Mortgage
$499,000
Outstanding Balance
$247,523
Interest Rate
5.69%
Mortgage Type
Construction
Estimated Equity
$784,377
Purchase Details
Closed on
Sep 16, 1998
Sold by
Garroch Alexander W
Bought by
Bender John W
Home Financials for this Owner
Home Financials are based on the most recent Mortgage that was taken out on this home.
Original Mortgage
$238,000
Interest Rate
6.9%
Purchase Details
Closed on
Apr 22, 1994
Sold by
Ryland Group Inc
Bought by
Garroch Alexander
Home Financials for this Owner
Home Financials are based on the most recent Mortgage that was taken out on this home.
Original Mortgage
$203,150
Interest Rate
7.6%
Purchase Details
Closed on
Nov 30, 1993
Sold by
Reston Land Corp
Bought by
Grp Ryland
Create a Home Valuation Report for This Property
The Home Valuation Report is an in-depth analysis detailing your home's value as well as a comparison with similar homes in the area
Home Values in the Area
Average Home Value in this Area
Purchase History
| Date | Buyer | Sale Price | Title Company |
|---|---|---|---|
| Cox Terri | $625,000 | -- | |
| Bender John W | $297,000 | -- | |
| Garroch Alexander | $298,675 | -- | |
| Grp Ryland | $71,000 | -- |
Source: Public Records
Mortgage History
| Date | Status | Borrower | Loan Amount |
|---|---|---|---|
| Open | Cox Terri | $499,000 | |
| Previous Owner | Grp Ryland | $238,000 | |
| Previous Owner | Grp Ryland | $203,150 |
Source: Public Records
Tax History Compared to Growth
Tax History
| Year | Tax Paid | Tax Assessment Tax Assessment Total Assessment is a certain percentage of the fair market value that is determined by local assessors to be the total taxable value of land and additions on the property. | Land | Improvement |
|---|---|---|---|---|
| 2025 | $10,068 | $927,460 | $344,000 | $583,460 |
| 2024 | $10,068 | $835,170 | $314,000 | $521,170 |
| 2023 | $9,439 | $803,000 | $314,000 | $489,000 |
| 2022 | $9,016 | $757,290 | $289,000 | $468,290 |
| 2021 | $8,793 | $720,460 | $264,000 | $456,460 |
| 2020 | $9,230 | $694,010 | $249,000 | $445,010 |
| 2019 | $6,283 | $709,730 | $249,000 | $460,730 |
| 2018 | $8,318 | $676,010 | $224,000 | $452,010 |
| 2017 | $8,008 | $662,920 | $214,000 | $448,920 |
| 2016 | $6,331 | $649,590 | $214,000 | $435,590 |
| 2015 | $7,555 | $649,590 | $214,000 | $435,590 |
| 2014 | $5,775 | $626,900 | $204,000 | $422,900 |
Source: Public Records
Map
Nearby Homes
- 2410 Dakota Lakes Dr
- 13082 Park Crescent Cir
- 13133 Park Crescent Cir
- 12968 Wood Crescent Cir
- 13083 Rose Petal Cir
- 12768 Sunrise Valley Dr
- 12925 Centre Park Cir Unit 311
- 12925 Centre Park Cir Unit 304
- 13056 Marcey Creek Rd Unit 13056
- 12933 Centre Park Cir Unit 305
- 12945 Centre Park Cir Unit 110
- 12956 Centre Park Cir Unit 410
- 12953 Centre Park Cir Unit 218
- 12958 Centre Park Cir Unit 120
- 2466 Clover Field Cir
- 2447 Clover Field Cir
- 12865 Mosaic Park Way Unit 3J
- 13123 Copper Brook Way
- 13103 Anvil Place
- 2619 New Banner Ln
- 2339 Colts Brook Dr
- 2337 Colts Brook Dr
- 2467 Sycamore Lakes Cove
- 2332 Colts Brook Dr
- 2330 Colts Brook Dr
- 12844 Williams Meadow Ct
- 2335 Colts Brook Dr
- 2333 Colts Brook Dr
- 2328 Colts Brook Dr
- 2327 Colts Brook Dr
- 2329 Colts Brook Dr
- 12846 Williams Meadow Ct
- 2468 Sycamore Lakes Cove
- 2331 Colts Brook Dr
- 2326 Colts Brook Dr
- 2470 Sycamore Lakes Cove
- 12805 Old Club Ln
- 12803 Old Club Ln
- 12845 Williams Meadow Ct
- 2472 Sycamore Lakes Cove