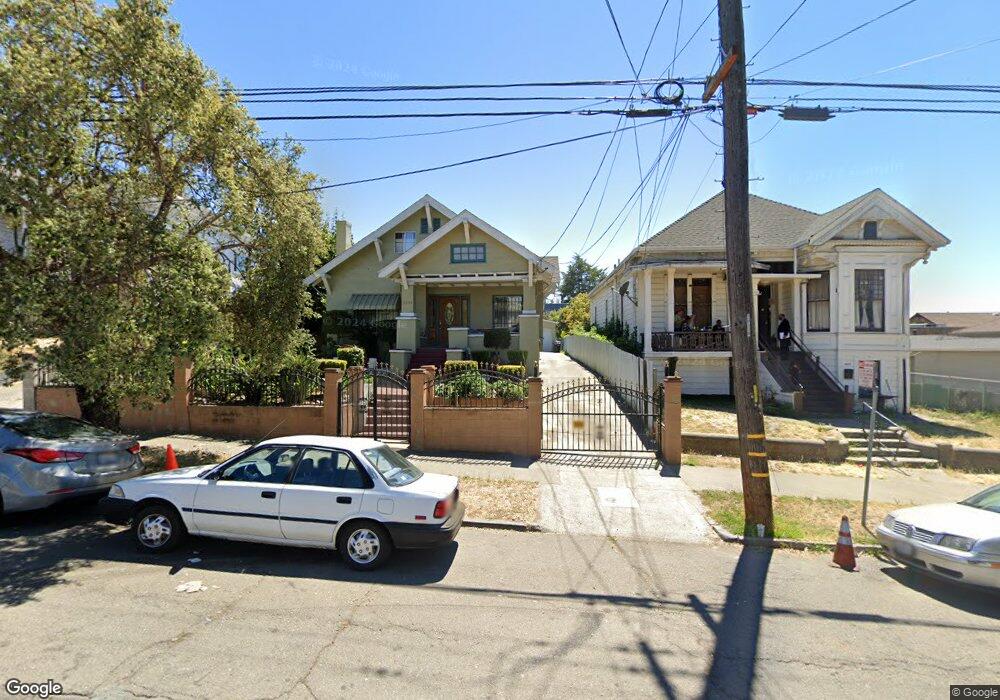
2341 E 20th St Oakland, CA 94601
Meadow Brook NeighborhoodEstimated Value: $582,434 - $632,000
Studio
--
Bath
1,822
Sq Ft
$330/Sq Ft
Est. Value
About This Home
This home is located at 2341 E 20th St, Oakland, CA 94601 and is currently estimated at $601,109, approximately $329 per square foot. 2341 E 20th St is a home located in Alameda County with nearby schools including Garfield Elementary School, Roosevelt Middle School, and Fremont High School.
Ownership History
Date
Name
Owned For
Owner Type
Purchase Details
Closed on
May 13, 1995
Sold by
Reeves Cecil P and Reeves Addie L
Bought by
Twenty Third Avenue Church Of God
Current Estimated Value
Purchase Details
Closed on
Dec 13, 1993
Sold by
Twenty Third Avenue Church Of God Inc
Bought by
Reeves Cecil P and Reeves Addie L
Home Financials for this Owner
Home Financials are based on the most recent Mortgage that was taken out on this home.
Original Mortgage
$108,000
Interest Rate
5.15%
Create a Home Valuation Report for This Property
The Home Valuation Report is an in-depth analysis detailing your home's value as well as a comparison with similar homes in the area
Home Values in the Area
Average Home Value in this Area
Purchase History
| Date | Buyer | Sale Price | Title Company |
|---|---|---|---|
| Twenty Third Avenue Church Of God | -- | -- | |
| Reeves Cecil P | $135,000 | Fidelity National Title Ins |
Source: Public Records
Mortgage History
| Date | Status | Borrower | Loan Amount |
|---|---|---|---|
| Previous Owner | Reeves Cecil P | $108,000 |
Source: Public Records
Tax History
| Year | Tax Paid | Tax Assessment Tax Assessment Total Assessment is a certain percentage of the fair market value that is determined by local assessors to be the total taxable value of land and additions on the property. | Land | Improvement |
|---|---|---|---|---|
| 2025 | $4,634 | $218,743 | $65,463 | $153,280 |
| 2024 | $4,634 | $214,455 | $64,180 | $150,275 |
| 2023 | $4,759 | $210,250 | $62,921 | $147,329 |
| 2022 | $4,576 | $206,128 | $61,688 | $144,440 |
| 2021 | $4,261 | $202,086 | $60,478 | $141,608 |
| 2020 | $4,211 | $200,015 | $59,858 | $140,157 |
| 2019 | $3,980 | $196,094 | $58,685 | $137,409 |
| 2018 | $3,898 | $192,249 | $57,534 | $134,715 |
| 2017 | $3,722 | $188,480 | $56,406 | $132,074 |
| 2016 | $3,529 | $184,786 | $55,301 | $129,485 |
| 2015 | $3,506 | $182,010 | $54,470 | $127,540 |
| 2014 | $3,411 | $178,445 | $53,403 | $125,042 |
Source: Public Records
Map
Nearby Homes
- 2322 E 21st St
- 2304 E 22nd St
- 2222 Inyo Ave
- 2207 E 21st St
- 2618 E 20th St
- 2017 27th Ave
- 2217 E 24th St
- 2216 E 23rd St
- 1545 23rd Ave
- 1547 23rd Ave
- 2036 E 20th St
- 2540 E 16th St Unit 2
- 2004 27th Ave
- 1526 Munson Way
- 2151 E 24th St
- 2021 Mitchell St
- 2443 24th Ave
- 2724 E 22nd St
- 2749 E 17th St
- 2138 19th Ave
Your Personal Tour Guide
Ask me questions while you tour the home.