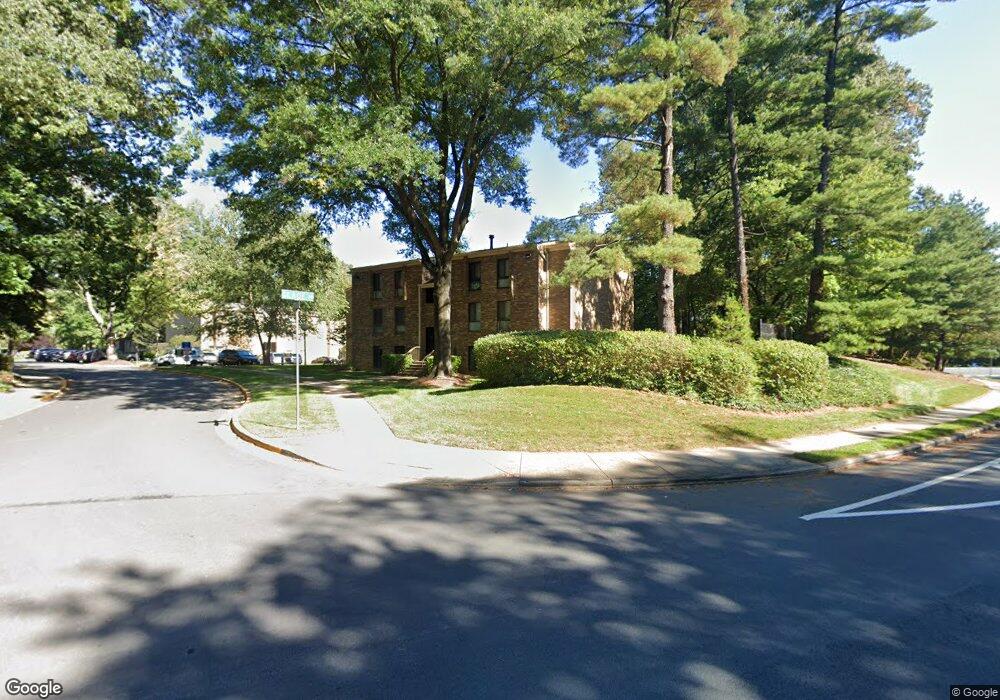
2341 Freetown Ct Unit 34/11C Reston, VA 20191
Estimated Value: $271,000
3
Beds
1
Bath
1,004
Sq Ft
$270/Sq Ft
Est. Value
About This Home
This home is located at 2341 Freetown Ct Unit 34/11C, Reston, VA 20191 and is currently estimated at $271,000, approximately $269 per square foot. 2341 Freetown Ct Unit 34/11C is a home located in Fairfax County with nearby schools including Dogwood Elementary, South Lakes High School, and Al Fatih Academy.
Ownership History
Date
Name
Owned For
Owner Type
Purchase Details
Closed on
Nov 8, 2019
Sold by
Ismail Faiza Mohamed and Abokor Mohamed Mohamoud
Bought by
Connor Investment Group Llc
Current Estimated Value
Purchase Details
Closed on
Feb 14, 2018
Sold by
Ismail Faiza M
Bought by
Ismail Faiza Mohamed and Abokor Mohamed Mohamoud
Home Financials for this Owner
Home Financials are based on the most recent Mortgage that was taken out on this home.
Original Mortgage
$136,000
Interest Rate
3.95%
Mortgage Type
New Conventional
Purchase Details
Closed on
Jun 7, 2004
Sold by
Mata Alcides
Bought by
Ismail Faiza M
Home Financials for this Owner
Home Financials are based on the most recent Mortgage that was taken out on this home.
Original Mortgage
$146,400
Interest Rate
5.99%
Mortgage Type
Purchase Money Mortgage
Create a Home Valuation Report for This Property
The Home Valuation Report is an in-depth analysis detailing your home's value as well as a comparison with similar homes in the area
Home Values in the Area
Average Home Value in this Area
Purchase History
| Date | Buyer | Sale Price | Title Company |
|---|---|---|---|
| Connor Investment Group Llc | $170,000 | Potomac West Title | |
| Ismail Faiza Mohamed | -- | National Settlement | |
| Ismail Faiza M | $183,000 | -- |
Source: Public Records
Mortgage History
| Date | Status | Borrower | Loan Amount |
|---|---|---|---|
| Previous Owner | Ismail Faiza Mohamed | $136,000 | |
| Previous Owner | Ismail Faiza M | $146,400 |
Source: Public Records
Tax History Compared to Growth
Tax History
| Year | Tax Paid | Tax Assessment Tax Assessment Total Assessment is a certain percentage of the fair market value that is determined by local assessors to be the total taxable value of land and additions on the property. | Land | Improvement |
|---|---|---|---|---|
| 2025 | $2,715 | $254,480 | $51,000 | $203,480 |
| 2024 | $2,715 | $225,200 | $45,000 | $180,200 |
| 2023 | $2,570 | $218,640 | $44,000 | $174,640 |
| 2022 | $2,345 | $196,970 | $39,000 | $157,970 |
| 2021 | $2,531 | $207,340 | $41,000 | $166,340 |
| 2020 | $2,430 | $197,470 | $39,000 | $158,470 |
| 2019 | $2,331 | $189,410 | $38,000 | $151,410 |
| 2018 | $2,100 | $182,590 | $37,000 | $145,590 |
| 2017 | $2,125 | $175,950 | $35,000 | $140,950 |
| 2016 | $2,175 | $180,460 | $36,000 | $144,460 |
| 2015 | $1,995 | $171,580 | $34,000 | $137,580 |
| 2014 | $1,839 | $158,460 | $32,000 | $126,460 |
Source: Public Records
Map
Nearby Homes
- 2418 Ridgehampton Ct
- 2317 Freetown Ct Unit 2B
- 2420 Freetown Dr
- 2273 Hunters Run Dr
- 2203 Hunters Run Dr
- 11824 Breton Ct Unit 24A
- 11841 Shire Ct Unit 31D
- 11808 Breton Ct Unit 12C
- 11813 Breton Ct Unit 1A
- 11837 Shire Ct Unit 22C
- 12402 Brown Fox Way
- 11933 Escalante Ct
- 2065 Royal Fern Ct Unit 38/12B
- 2300 Horseferry Ct
- 11817 Coopers Ct
- 2042 Royal Fern Ct Unit 1B
- 2142 Cartwright Place
- 2058 Royal Fern Ct Unit 26/1C
- 11751 Mossy Creek Ln
- 11813 Triple Crown Rd
- 2341 Freetown Ct Unit 1B
- 2341 Freetown Ct Unit 22C
- 2341 Freetown Ct Unit 21C
- 2341 Freetown Ct Unit 34/1B
- 2341 Freetown Ct Unit 11C
- 2339 Freetown Ct Unit 21C
- 2339 Freetown Ct Unit 11C
- 2339 Freetown Ct Unit 33/22C
- 2339 Freetown Ct Unit 2B
- 2339 Freetown Ct Unit 22C
- 2339 Freetown Ct Unit 12C
- 2337 Freetown Ct Unit 11C
- 2337 Freetown Ct Unit 22C
- 2333 Freetown Ct Unit 31/22C
- 2333 Freetown Ct Unit 11C
- 2333 Freetown Ct Unit 2B
- 2335 Freetown Ct Unit 30/1B
- 2335 Freetown Ct Unit 30/11C
- 2335 Freetown Ct Unit 1B
- 2334 Freetown Ct Unit 2/12C