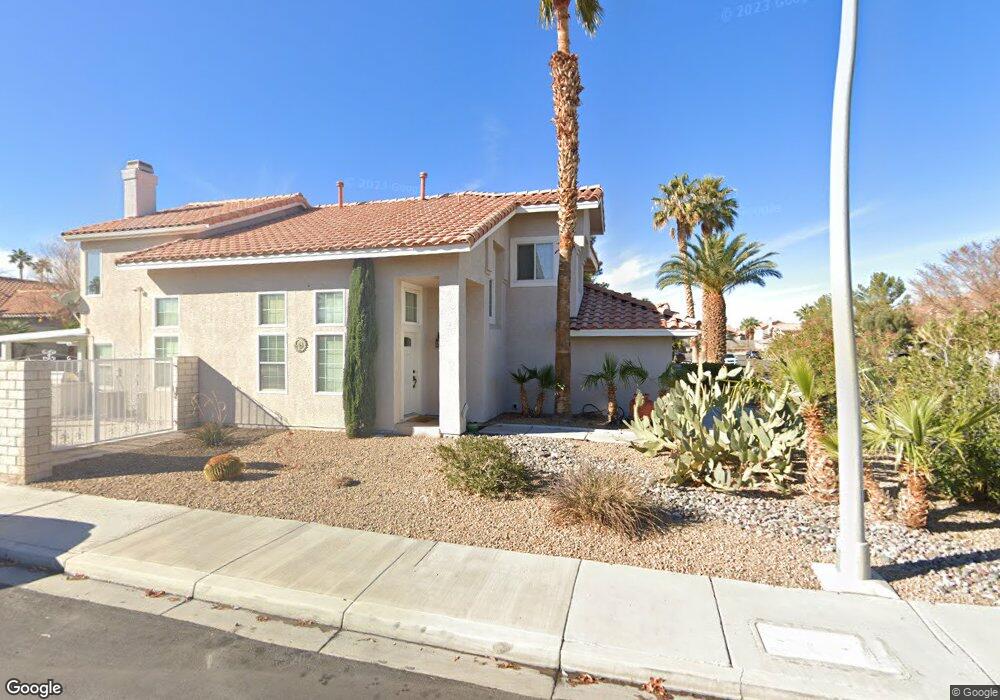
2341 Mabee Ct Henderson, NV 89074
Green Valley North NeighborhoodEstimated Value: $487,616 - $553,000
4
Beds
3
Baths
2,065
Sq Ft
$255/Sq Ft
Est. Value
About This Home
This home is located at 2341 Mabee Ct, Henderson, NV 89074 and is currently estimated at $527,404, approximately $255 per square foot. 2341 Mabee Ct is a home located in Clark County with nearby schools including Nate Mack Elementary School, Barbara and Hank Greenspun Junior High School, and Green Valley High School.
Ownership History
Date
Name
Owned For
Owner Type
Purchase Details
Closed on
Jul 7, 2009
Sold by
Gage Kendra
Bought by
Bauer William J
Current Estimated Value
Home Financials for this Owner
Home Financials are based on the most recent Mortgage that was taken out on this home.
Original Mortgage
$217,979
Outstanding Balance
$136,683
Interest Rate
4.87%
Mortgage Type
FHA
Estimated Equity
$390,721
Purchase Details
Closed on
Jun 30, 2009
Sold by
Bloch Brenda L
Bought by
Bauer William J
Home Financials for this Owner
Home Financials are based on the most recent Mortgage that was taken out on this home.
Original Mortgage
$217,979
Outstanding Balance
$136,683
Interest Rate
4.87%
Mortgage Type
FHA
Estimated Equity
$390,721
Purchase Details
Closed on
Oct 20, 2005
Sold by
Strauss Eric R and Strauss Pamela
Bought by
Bloch Brenda L
Home Financials for this Owner
Home Financials are based on the most recent Mortgage that was taken out on this home.
Original Mortgage
$316,000
Interest Rate
7.75%
Mortgage Type
Unknown
Create a Home Valuation Report for This Property
The Home Valuation Report is an in-depth analysis detailing your home's value as well as a comparison with similar homes in the area
Home Values in the Area
Average Home Value in this Area
Purchase History
| Date | Buyer | Sale Price | Title Company |
|---|---|---|---|
| Bauer William J | -- | North American Title Main | |
| Bauer William J | $222,000 | North American Title Main | |
| Bloch Brenda L | $395,000 | Nevada Title |
Source: Public Records
Mortgage History
| Date | Status | Borrower | Loan Amount |
|---|---|---|---|
| Open | Bauer William J | $217,979 | |
| Previous Owner | Bloch Brenda L | $316,000 |
Source: Public Records
Tax History
| Year | Tax Paid | Tax Assessment Tax Assessment Total Assessment is a certain percentage of the fair market value that is determined by local assessors to be the total taxable value of land and additions on the property. | Land | Improvement |
|---|---|---|---|---|
| 2026 | $2,988 | $101,816 | $36,750 | $65,066 |
| 2025 | $2,766 | $102,290 | $35,000 | $67,290 |
| 2024 | $2,562 | $102,290 | $35,000 | $67,290 |
| 2023 | $2,562 | $97,475 | $33,250 | $64,225 |
| 2022 | $2,373 | $86,966 | $27,720 | $59,246 |
| 2021 | $2,197 | $82,196 | $25,550 | $56,646 |
| 2020 | $2,037 | $80,269 | $23,800 | $56,469 |
| 2019 | $1,909 | $77,583 | $21,700 | $55,883 |
| 2018 | $1,822 | $71,770 | $17,850 | $53,920 |
| 2017 | $2,090 | $72,118 | $17,150 | $54,968 |
| 2016 | $1,706 | $68,275 | $12,950 | $55,325 |
| 2015 | $1,702 | $64,569 | $10,850 | $53,719 |
| 2014 | $1,649 | $58,162 | $9,275 | $48,887 |
Source: Public Records
Map
Nearby Homes
- 2332 Schillings Ct
- 340 Templeton Dr
- 345 Templeton Dr
- 2343 Villandry Ct
- 2413 Muirfield Ave
- 2309 Prometheus Ct
- 332 Cavalla St
- 379 Abbington St
- 318 Lindbrook St
- 2504 Mahaila Cir
- 2263 Heavenly View Dr
- 2215 Heavenly View Dr
- 2252 Buckingham Ct
- 2546 Wolverton Ave
- 2262 Cassatt Dr
- 2249 Darwin Cir
- 2251 Van Gogh Dr
- 8 Hummingbird Ln
- 9 Quail Run Rd
- 2376 Tilden Way
- 2343 Mabee Ct
- 2345 Mabee Ct
- 2362 Millcroft Dr
- 2338 Weyburn Ct
- 2364 Millcroft Dr
- 2366 Millcroft Dr
- 2347 Mabee Ct
- 2342 Mabee Ct
- 2344 Mabee Ct
- 2368 Millcroft Dr
- 2337 Danville Ct
- 2349 Mabee Ct
- 2349 Mabee Ct
- 2336 Weyburn Ct
- 2346 Mabee Ct
- 2346 Mabee Ct Unit n/a
- 2370 Millcroft Dr
- 2335 Danville Ct
- 2348 Mabee Ct
- 2335 Weyburn Ct
Your Personal Tour Guide
Ask me questions while you tour the home.