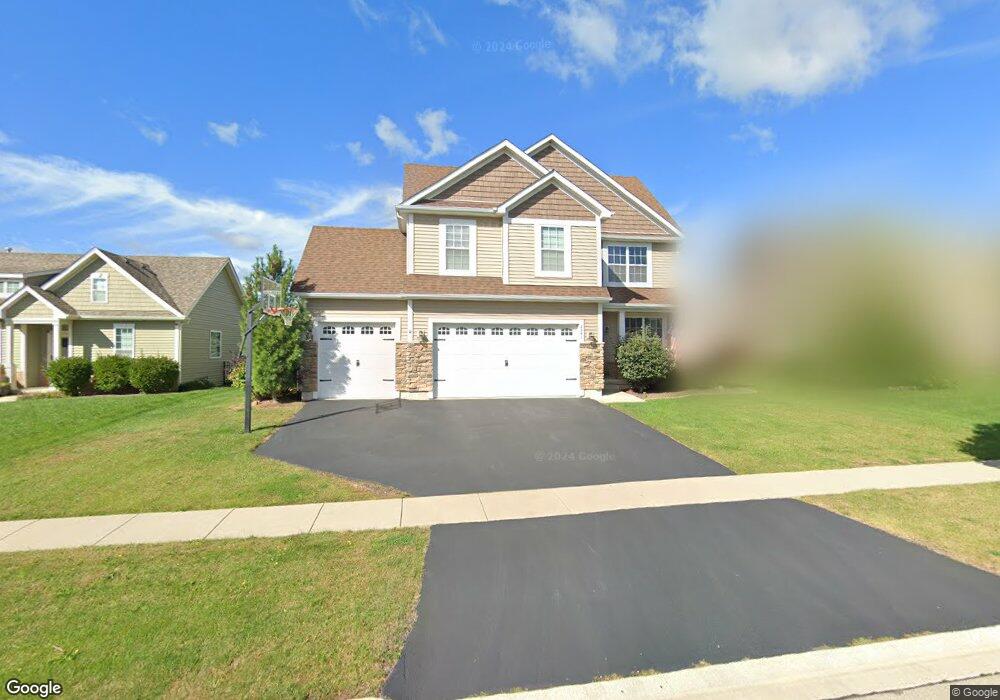
2341 Pioneer Way Sycamore, IL 60178
Estimated Value: $430,000 - $454,000
4
Beds
4
Baths
2,287
Sq Ft
$193/Sq Ft
Est. Value
About This Home
This home is located at 2341 Pioneer Way, Sycamore, IL 60178 and is currently estimated at $441,597, approximately $193 per square foot. 2341 Pioneer Way is a home with nearby schools including Sycamore High School, St Mary's Catholic School, and Cornerstone Christian Academy.
Ownership History
Date
Name
Owned For
Owner Type
Purchase Details
Closed on
Jan 29, 2014
Sold by
Silverthorne Development Co
Bought by
Meier Jeffrey S and Meier Jozette M
Current Estimated Value
Home Financials for this Owner
Home Financials are based on the most recent Mortgage that was taken out on this home.
Original Mortgage
$232,870
Outstanding Balance
$177,855
Interest Rate
4.62%
Mortgage Type
FHA
Estimated Equity
$263,742
Purchase Details
Closed on
Sep 17, 2013
Sold by
Sng Land Llc
Bought by
Silverthorne Development Co
Home Financials for this Owner
Home Financials are based on the most recent Mortgage that was taken out on this home.
Original Mortgage
$140,500
Interest Rate
4.39%
Mortgage Type
Construction
Purchase Details
Closed on
May 23, 2013
Sold by
Old Second National Bank
Bought by
Sng Land Llc
Purchase Details
Closed on
Nov 17, 2010
Sold by
Dekalb County Sheriff
Bought by
Old Second National Bank
Create a Home Valuation Report for This Property
The Home Valuation Report is an in-depth analysis detailing your home's value as well as a comparison with similar homes in the area
Home Values in the Area
Average Home Value in this Area
Purchase History
| Date | Buyer | Sale Price | Title Company |
|---|---|---|---|
| Meier Jeffrey S | $237,500 | -- | |
| Silverthorne Development Co | -- | -- | |
| Sng Land Llc | $140,000 | -- | |
| Old Second National Bank | -- | -- |
Source: Public Records
Mortgage History
| Date | Status | Borrower | Loan Amount |
|---|---|---|---|
| Open | Meier Jeffrey S | $232,870 | |
| Previous Owner | Silverthorne Development Co | $140,500 |
Source: Public Records
Tax History Compared to Growth
Tax History
| Year | Tax Paid | Tax Assessment Tax Assessment Total Assessment is a certain percentage of the fair market value that is determined by local assessors to be the total taxable value of land and additions on the property. | Land | Improvement |
|---|---|---|---|---|
| 2024 | $8,967 | $115,122 | $10,778 | $104,344 |
| 2023 | $8,967 | $105,125 | $9,842 | $95,283 |
| 2022 | $8,569 | $96,419 | $9,027 | $87,392 |
| 2021 | $7,962 | $90,517 | $8,474 | $82,043 |
| 2020 | $7,850 | $88,292 | $8,266 | $80,026 |
| 2019 | $7,722 | $86,358 | $8,085 | $78,273 |
| 2018 | $7,708 | $84,929 | $8,082 | $76,847 |
| 2017 | $8,128 | $79,795 | $7,762 | $72,033 |
| 2016 | $8,363 | $80,004 | $19,135 | $60,869 |
| 2015 | -- | $75,297 | $18,009 | $57,288 |
| 2014 | -- | $71,082 | $17,101 | $53,981 |
| 2013 | -- | $135 | $135 | $0 |
Source: Public Records
Map
Nearby Homes
- 326 Davis Dr
- 318 Davis Dr
- Cypress Plan at North Grove Crossings
- Hawthorn Plan at North Grove Crossings
- 513 Amherst Dr
- 224 Whittemore Dr
- 218 Whittemore Dr
- 209 Whittemore Dr
- 233 Whittemore Dr
- 2320 Coventry Cir S
- 2310 Dean St
- 2 Bedroom/Sunroom Plan at Camden Crossing
- 2 Bedroom Plan at Camden Crossing
- 1 Bedroom Plan at Camden Crossing
- 169 Plank Rd
- 401 John Marshall Ln
- 223 Merry Oaks Dr
- 2203 Wickford Ln
- Lot 86 Merry Oaks Dr
- Lot 97 Merry Oaks Dr
- LOT 71 Pioneer Way
- 2357 Pioneer Way
- 2365 Pioneer Way
- 000 Pioneer Way
- 532 Brighton Way
- 2444 Luther Lowell Ln
- 2452 Luther Lowell Ln
- 2436 Luther Lowell Ln
- 2460 Luther Lowell Ln
- 2468 Luther Lowell Ln
- Lot 74 Pioneer Way
- Lot 72 Pioneer Way
- LOT 99 Pioneer Way
- Lot 101 Pioneer Way
- Lot 75 Pioneer Way
- Lot 76 Pioneer Way
- 2318 Pioneer Way
- 2349 Pioneer Way
- 2320 Luther Lowell Ln
- 540 Brighton Way