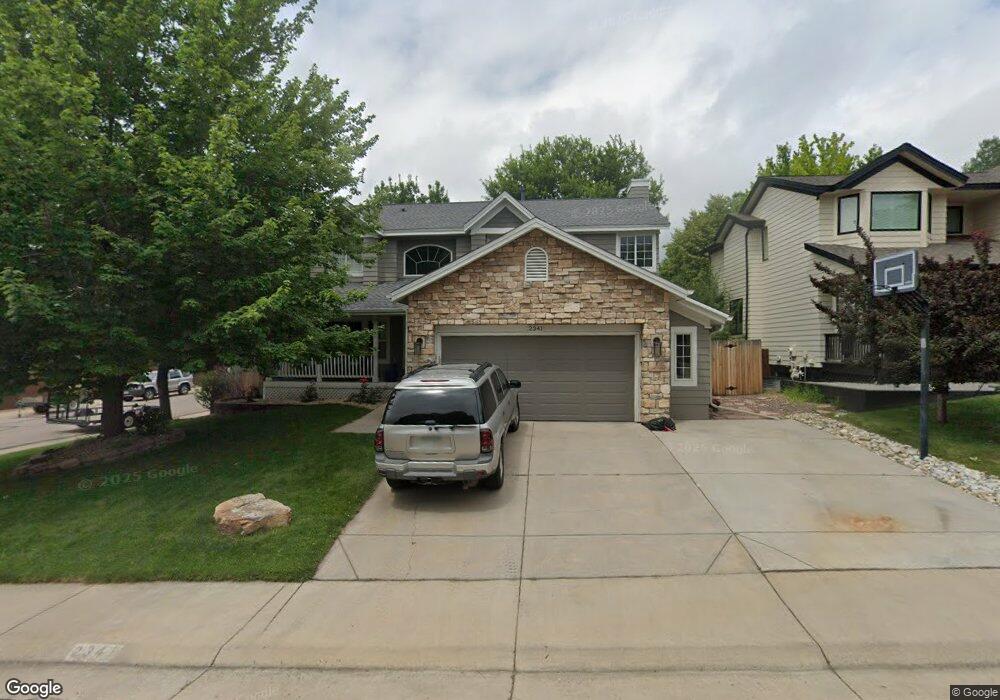
2341 S Fig St Lakewood, CO 80228
Green Mountain NeighborhoodEstimated Value: $825,000 - $948,000
4
Beds
7
Baths
2,532
Sq Ft
$347/Sq Ft
Est. Value
About This Home
This home is located at 2341 S Fig St, Lakewood, CO 80228 and is currently estimated at $879,269, approximately $347 per square foot. 2341 S Fig St is a home located in Jefferson County with nearby schools including Rooney Ranch Elementary School, Dunstan Middle School, and Green Mountain High School.
Ownership History
Date
Name
Owned For
Owner Type
Purchase Details
Closed on
Feb 27, 2004
Sold by
Melvin Kent A and Melvin Cindy S
Bought by
Boehm David E and Boehm Connie J
Current Estimated Value
Home Financials for this Owner
Home Financials are based on the most recent Mortgage that was taken out on this home.
Original Mortgage
$319,200
Outstanding Balance
$148,971
Interest Rate
5.65%
Mortgage Type
Purchase Money Mortgage
Estimated Equity
$730,298
Purchase Details
Closed on
Mar 25, 1996
Sold by
Richardson Patrick J and Richardson Bonnie L
Bought by
Melvin Kent A and Melvin Cindy S
Home Financials for this Owner
Home Financials are based on the most recent Mortgage that was taken out on this home.
Original Mortgage
$156,000
Interest Rate
6.92%
Purchase Details
Closed on
Nov 2, 1995
Sold by
Valley Dietz Linda
Bought by
Richardson Patrick J and Richardson Bonnie L
Create a Home Valuation Report for This Property
The Home Valuation Report is an in-depth analysis detailing your home's value as well as a comparison with similar homes in the area
Home Values in the Area
Average Home Value in this Area
Purchase History
| Date | Buyer | Sale Price | Title Company |
|---|---|---|---|
| Boehm David E | $399,000 | Guardian Title | |
| Melvin Kent A | $216,750 | -- | |
| Richardson Patrick J | -- | -- |
Source: Public Records
Mortgage History
| Date | Status | Borrower | Loan Amount |
|---|---|---|---|
| Open | Boehm David E | $319,200 | |
| Previous Owner | Melvin Kent A | $156,000 | |
| Closed | Boehm David E | $59,850 |
Source: Public Records
Tax History Compared to Growth
Tax History
| Year | Tax Paid | Tax Assessment Tax Assessment Total Assessment is a certain percentage of the fair market value that is determined by local assessors to be the total taxable value of land and additions on the property. | Land | Improvement |
|---|---|---|---|---|
| 2024 | $4,685 | $51,949 | $17,518 | $34,431 |
| 2023 | $4,685 | $51,949 | $17,518 | $34,431 |
| 2022 | $3,908 | $42,357 | $13,528 | $28,829 |
| 2021 | $3,964 | $43,576 | $13,917 | $29,659 |
| 2020 | $3,634 | $40,128 | $12,586 | $27,542 |
| 2019 | $3,587 | $40,128 | $12,586 | $27,542 |
| 2018 | $3,254 | $35,204 | $9,096 | $26,108 |
| 2017 | $2,859 | $35,204 | $9,096 | $26,108 |
| 2016 | $3,168 | $36,387 | $9,148 | $27,239 |
| 2015 | $2,951 | $36,387 | $9,148 | $27,239 |
| 2014 | $2,951 | $31,059 | $6,136 | $24,923 |
Source: Public Records
Map
Nearby Homes
- 2332 S Fig St
- 2336 S Eldridge Ct
- 13804 W Iliff Ave
- 2540 S Deframe St
- 14420 W Yale Place
- 2663 S Deframe Cir
- 2675 S Deframe Cir
- 15116 W Harvard Cir
- 13934 W Warren Dr
- 14540 W Amherst Place
- 14976 W Warren Ave
- 13815 W Amherst Way
- 14630 W Amherst Place
- 2811 S Fig St
- 2175 S Deframe St
- 2126 S Juniper St
- 2347 S Loveland St
- 2703 S Cole Ct
- 2385 S Loveland Way
- 2914 S Deframe Way
- 2331 S Fig St
- 2336 S Flora St
- 2361 S Fig St
- 2321 S Fig St
- 2326 S Flora St
- 2342 S Fig St
- 2322 S Fig St
- 14312 W Wesley Cir
- 2352 S Fig St
- 2301 S Fig St
- 2371 S Fig St
- 2306 S Flora St
- 14314 W Wesley Cir
- 2312 S Fig St
- 2362 S Fig St
- 14316 W Wesley Cir
- 2381 S Fig St
- 2302 S Fig St
- 2349 S Ellis Ct
- 2372 S Fig St