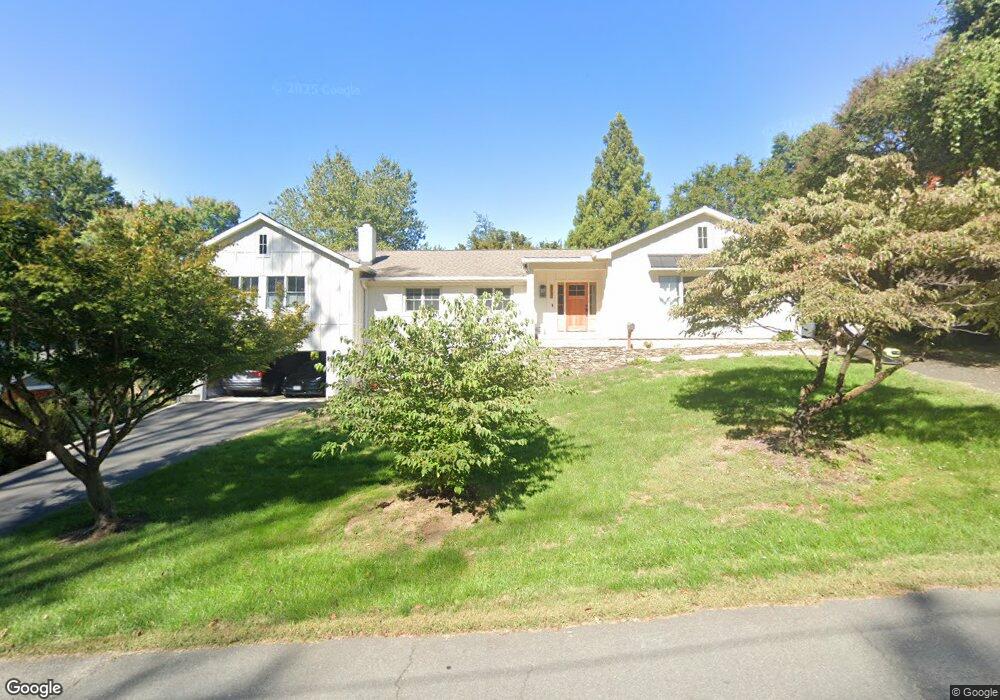
2342 Dale Dr Falls Church, VA 22043
Estimated Value: $1,201,000 - $1,720,000
5
Beds
3
Baths
2,496
Sq Ft
$543/Sq Ft
Est. Value
About This Home
This home is located at 2342 Dale Dr, Falls Church, VA 22043 and is currently estimated at $1,355,148, approximately $542 per square foot. 2342 Dale Dr is a home located in Fairfax County with nearby schools including Kilmer Middle School, Marshall High School, and St. James Catholic School.
Ownership History
Date
Name
Owned For
Owner Type
Purchase Details
Closed on
Jun 23, 2021
Sold by
Hsu Allan
Bought by
Hsu Allan and Hsu Amanda Reynolds
Current Estimated Value
Home Financials for this Owner
Home Financials are based on the most recent Mortgage that was taken out on this home.
Original Mortgage
$1,112,000
Outstanding Balance
$1,006,777
Interest Rate
2.9%
Mortgage Type
Construction
Estimated Equity
$348,371
Purchase Details
Closed on
Aug 30, 2006
Sold by
Silla Eric
Bought by
Hsu Allan and Hsu Ming-Eng
Home Financials for this Owner
Home Financials are based on the most recent Mortgage that was taken out on this home.
Original Mortgage
$528,000
Interest Rate
6.83%
Mortgage Type
New Conventional
Purchase Details
Closed on
Nov 13, 1998
Sold by
Crawford Noreta M
Bought by
Silla Eric
Home Financials for this Owner
Home Financials are based on the most recent Mortgage that was taken out on this home.
Original Mortgage
$150,000
Interest Rate
6.65%
Create a Home Valuation Report for This Property
The Home Valuation Report is an in-depth analysis detailing your home's value as well as a comparison with similar homes in the area
Home Values in the Area
Average Home Value in this Area
Purchase History
| Date | Buyer | Sale Price | Title Company |
|---|---|---|---|
| Hsu Allan | -- | Accommodation | |
| Hsu Allan | $660,000 | -- | |
| Silla Eric | $270,000 | -- |
Source: Public Records
Mortgage History
| Date | Status | Borrower | Loan Amount |
|---|---|---|---|
| Open | Hsu Allan | $1,112,000 | |
| Previous Owner | Hsu Allan | $528,000 | |
| Previous Owner | Silla Eric | $150,000 |
Source: Public Records
Tax History Compared to Growth
Tax History
| Year | Tax Paid | Tax Assessment Tax Assessment Total Assessment is a certain percentage of the fair market value that is determined by local assessors to be the total taxable value of land and additions on the property. | Land | Improvement |
|---|---|---|---|---|
| 2025 | $13,226 | $1,147,130 | $492,000 | $655,130 |
| 2024 | $13,226 | $1,076,130 | $452,000 | $624,130 |
| 2023 | $10,476 | $875,600 | $432,000 | $443,600 |
| 2022 | $10,314 | $851,500 | $412,000 | $439,500 |
| 2021 | $9,941 | $804,810 | $382,000 | $422,810 |
| 2020 | $8,893 | $712,950 | $317,000 | $395,950 |
| 2019 | $9,286 | $744,550 | $317,000 | $427,550 |
| 2018 | $8,562 | $744,550 | $317,000 | $427,550 |
| 2017 | $8,999 | $737,170 | $313,000 | $424,170 |
| 2016 | $8,780 | $718,820 | $307,000 | $411,820 |
| 2015 | $7,987 | $675,670 | $288,000 | $387,670 |
| 2014 | $7,678 | $649,760 | $277,000 | $372,760 |
Source: Public Records
Map
Nearby Homes
- 2335 Dale Dr
- 7334 Pinecastle Rd
- 2417 Falls Place Ct
- 2339 Barbour Rd
- 255 W Falls Station Blvd Unit 704
- 255 W Falls Station Blvd Unit PH3
- 255 W Falls Station Blvd Unit 1004
- 255 W Falls Station Blvd Unit PH8
- 255 W Falls Station Blvd Unit 609
- 255 W Falls Station Blvd Unit 314
- 255 W Falls Station Blvd Unit 607
- 255 W Falls Station Blvd Unit 302
- 255 W Falls Station Blvd Unit PH1
- 255 W Falls Station Blvd Unit PH4
- 255 W Falls Station Blvd Unit 911
- 255 W Falls Station Blvd Unit 206
- 255 W Falls Station Blvd Unit 608
- 255 W Falls Station Blvd Unit 315
- 255 W Falls Station Blvd Unit PH5
- 255 W Falls Station Blvd Unit 405
- 2344 Dale Dr
- 7219 Gordons Rd
- 7215 Gordons Rd
- 2343 Dale Dr
- 2341 Dale Dr
- 7211 Gordons Rd
- 7318 Pinecastle Rd
- 7301 Gordons Rd
- 2345 Dale Dr
- 7320 Pinecastle Rd
- 7316 Pinecastle Rd
- 7322 Pinecastle Rd
- 2338 Dale Dr
- 7303 Gordons Rd
- 2337 Dale Dr
- 7210 Deerfield Ct
- 7207 Gordons Rd
- 7324 Pinecastle Rd
- 7319 Pinecastle Rd
- 7300 Gordons Rd