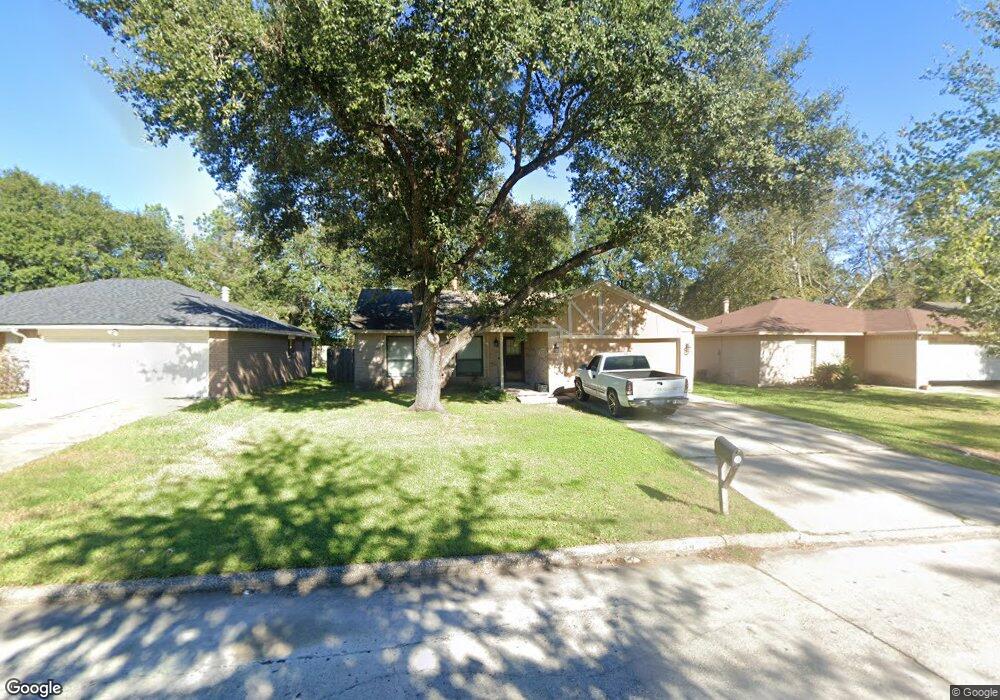
23426 Wintergate Dr Spring, TX 77373
Estimated Value: $191,000 - $205,000
3
Beds
2
Baths
1,310
Sq Ft
$151/Sq Ft
Est. Value
About This Home
This home is located at 23426 Wintergate Dr, Spring, TX 77373 and is currently estimated at $197,722, approximately $150 per square foot. 23426 Wintergate Dr is a home located in Harris County with nearby schools including Mildred Jenkins Elementary School, Dueitt Middle School, and Spring High School.
Ownership History
Date
Name
Owned For
Owner Type
Purchase Details
Closed on
Apr 16, 2015
Sold by
Moran Jennifer Ann and Avilez Jennifer
Bought by
Moran Jennifer Ann
Current Estimated Value
Home Financials for this Owner
Home Financials are based on the most recent Mortgage that was taken out on this home.
Original Mortgage
$79,700
Outstanding Balance
$61,577
Interest Rate
3.84%
Mortgage Type
New Conventional
Estimated Equity
$136,145
Purchase Details
Closed on
Apr 13, 2007
Sold by
Machado Ann M and Machado Ann Mary
Bought by
Avilez Jennifer
Home Financials for this Owner
Home Financials are based on the most recent Mortgage that was taken out on this home.
Original Mortgage
$84,500
Interest Rate
6.19%
Mortgage Type
Purchase Money Mortgage
Purchase Details
Closed on
Oct 29, 1999
Sold by
Machado Raul A
Bought by
Machado Ann Mary
Create a Home Valuation Report for This Property
The Home Valuation Report is an in-depth analysis detailing your home's value as well as a comparison with similar homes in the area
Home Values in the Area
Average Home Value in this Area
Purchase History
| Date | Buyer | Sale Price | Title Company |
|---|---|---|---|
| Moran Jennifer Ann | -- | None Available | |
| Avilez Jennifer | -- | American Title Co | |
| Machado Ann Mary | -- | -- |
Source: Public Records
Mortgage History
| Date | Status | Borrower | Loan Amount |
|---|---|---|---|
| Open | Moran Jennifer Ann | $79,700 | |
| Closed | Avilez Jennifer | $84,500 | |
| Closed | Machado Ann Mary | $0 |
Source: Public Records
Tax History
| Year | Tax Paid | Tax Assessment Tax Assessment Total Assessment is a certain percentage of the fair market value that is determined by local assessors to be the total taxable value of land and additions on the property. | Land | Improvement |
|---|---|---|---|---|
| 2025 | $2,622 | $213,826 | $37,460 | $176,366 |
| 2024 | $2,622 | $214,928 | $37,460 | $177,468 |
| 2023 | $2,622 | $220,125 | $37,460 | $182,665 |
| 2022 | $3,203 | $200,643 | $37,460 | $163,183 |
| 2021 | $3,085 | $154,186 | $21,173 | $133,013 |
| 2020 | $2,995 | $134,476 | $21,173 | $113,303 |
| 2019 | $2,822 | $124,118 | $21,173 | $102,945 |
| 2018 | $1,930 | $119,818 | $21,173 | $98,645 |
| 2017 | $2,306 | $119,818 | $21,173 | $98,645 |
| 2016 | $2,096 | $90,359 | $14,658 | $75,701 |
| 2015 | $1,452 | $81,595 | $14,658 | $66,937 |
| 2014 | $1,452 | $71,259 | $14,658 | $56,601 |
Source: Public Records
Map
Nearby Homes
- 23430 Wintergate Dr
- 4519 Tylergate Dr
- 4527 Adonis Dr
- 4538 Burkegate Dr
- 4542 Algernon Dr
- 4610 Sloangate Dr
- 4515 Mossygate Dr
- 4423 Mossygate Dr
- 4318 Burkegate Dr
- 4606 Fitzwater Dr
- 4831 Blue Jacaranda Way
- 4425 Algernon Dr
- 4814 Adonis Dr
- 4311 Enchantedgate Dr
- 4330 Tylergate Dr
- 4307 Sloangate Dr
- 4303 Chestergate Dr
- 23815 Firegate Dr
- 23663 Rainbow Eucalyptus Dr
- 23115 Ludgate Dr
- 23422 Wintergate Dr
- 23418 Wintergate Dr
- 23434 Wintergate Dr
- 4539 Towergate Dr
- 23414 Wintergate Dr
- 4534 Sloangate Dr
- 4535 Towergate Dr
- 23410 Wintergate Dr
- 4530 Sloangate Dr
- 4538 Towergate Dr
- 23502 Wintergate Dr
- 4531 Towergate Dr
- 4534 Towergate Dr
- 23406 Wintergate Dr
- 4535 Sloangate Dr
- 23506 Wintergate Dr
- 4527 Towergate Dr
- 4530 Towergate Dr
- 4531 Sloangate Dr
- 4535 Tylergate Dr
Your Personal Tour Guide
Ask me questions while you tour the home.