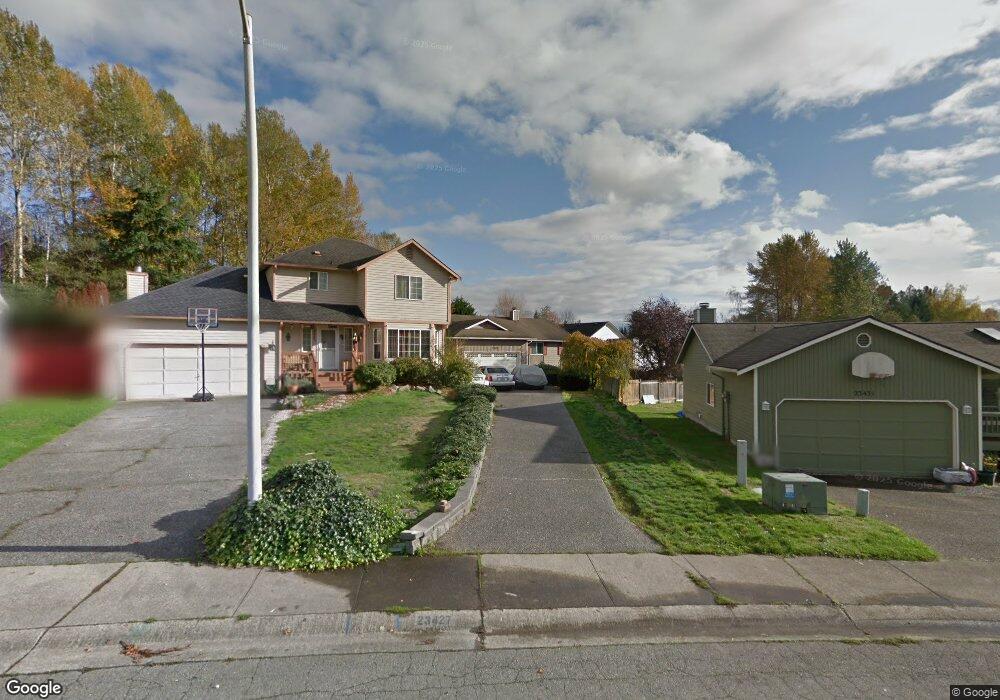
23427 12th Place W Bothell, WA 98021
Queensborough-Brentwood NeighborhoodEstimated Value: $828,000 - $929,000
3
Beds
2
Baths
1,335
Sq Ft
$648/Sq Ft
Est. Value
About This Home
This home is located at 23427 12th Place W, Bothell, WA 98021 and is currently estimated at $865,588, approximately $648 per square foot. 23427 12th Place W is a home located in Snohomish County with nearby schools including Lockwood Elementary School, Kenmore Middle School, and Bothell High School.
Ownership History
Date
Name
Owned For
Owner Type
Purchase Details
Closed on
Oct 16, 2013
Sold by
Tompkins Richard L
Bought by
Tompkins Richard L and Tompkins Julia C
Current Estimated Value
Purchase Details
Closed on
Aug 10, 2012
Sold by
Tompkins Suzanne L
Bought by
Tompkins Suzanne Louise
Purchase Details
Closed on
Nov 17, 2005
Sold by
Yekel Bruce R
Bought by
Tompkins Suzanne L
Home Financials for this Owner
Home Financials are based on the most recent Mortgage that was taken out on this home.
Original Mortgage
$267,960
Outstanding Balance
$141,777
Interest Rate
5.97%
Mortgage Type
Fannie Mae Freddie Mac
Estimated Equity
$723,811
Create a Home Valuation Report for This Property
The Home Valuation Report is an in-depth analysis detailing your home's value as well as a comparison with similar homes in the area
Home Values in the Area
Average Home Value in this Area
Purchase History
We collect this data history from publicly available records. To have your information removed, we recommend requesting removal directly through your county’s website.
| Date | Buyer | Sale Price | Title Company |
|---|---|---|---|
| Tompkins Richard L | -- | Accommodation | |
| Tompkins Suzanne Louise | -- | Accommodation | |
| Tompkins Suzanne L | $334,950 | First American Title Ins Co |
Source: Public Records
Mortgage History
We collect this data history from publicly available records. To have your information removed, we recommend requesting removal directly through your county’s website.
| Date | Status | Borrower | Loan Amount |
|---|---|---|---|
| Open | Tompkins Suzanne L | $267,960 |
Source: Public Records
Tax History
| Year | Tax Paid | Tax Assessment Tax Assessment Total Assessment is a certain percentage of the fair market value that is determined by local assessors to be the total taxable value of land and additions on the property. | Land | Improvement |
|---|---|---|---|---|
| 2026 | $6,308 | $750,900 | $541,300 | $209,600 |
| 2025 | $6,300 | $740,300 | $533,500 | $206,800 |
| 2024 | $6,300 | $745,200 | $538,400 | $206,800 |
| 2023 | $6,649 | $857,300 | $620,800 | $236,500 |
| 2022 | $5,990 | $617,600 | $417,100 | $200,500 |
| 2020 | $5,092 | $487,300 | $311,000 | $176,300 |
| 2019 | $4,428 | $433,200 | $260,000 | $173,200 |
| 2018 | $4,118 | $379,500 | $225,000 | $154,500 |
| 2017 | $3,394 | $320,100 | $175,000 | $145,100 |
| 2016 | $3,245 | $296,200 | $160,000 | $136,200 |
| 2015 | $2,964 | $253,800 | $145,000 | $108,800 |
| 2013 | $2,815 | $209,400 | $124,000 | $85,400 |
Source: Public Records
Map
Nearby Homes
- 23606 Lake Dr W
- 1329 237th Place SW
- 23327 8th Place W
- 23809 Lake Dr E
- 23807 7th Place W
- 922 240th Place SW
- 23705 7th Ave W
- 23716 Locust Way
- 921 241st Place SW
- 714 228th St SW Unit O101
- 24124 8th Place W
- 23708 Locust Way Unit 35
- 23708 Locust Way Unit 23
- 23708 Locust Way Unit 1
- 23619 5th Ave W
- 1425 243rd Place SW
- 600 228th St SW Unit I101
- 1900 240th Place SW
- 24123 7th Ave W
- 1524 243rd Place SW Unit A
- 23423 12th Place W
- 1209 235th Place SW
- 1201 235th Place SW
- 23431 12th Place W
- 23413 12th Place W
- 1133 235th Place SW
- 1219 235th Place SW
- 1225 235th Place SW
- 23424 12th Place W
- 1218 234th St SW
- 1123 235th Place SW
- 23401 12th Place W
- 1210 235th Place SW
- 1202 235th Place SW
- 1220 235th Place SW
- 1132 235th Place SW
- 1224 234th St SW
- 1224 235th Place SW
- 23430 12th Place W
- 23426 12th Place W
Your Personal Tour Guide
Ask me questions while you tour the home.