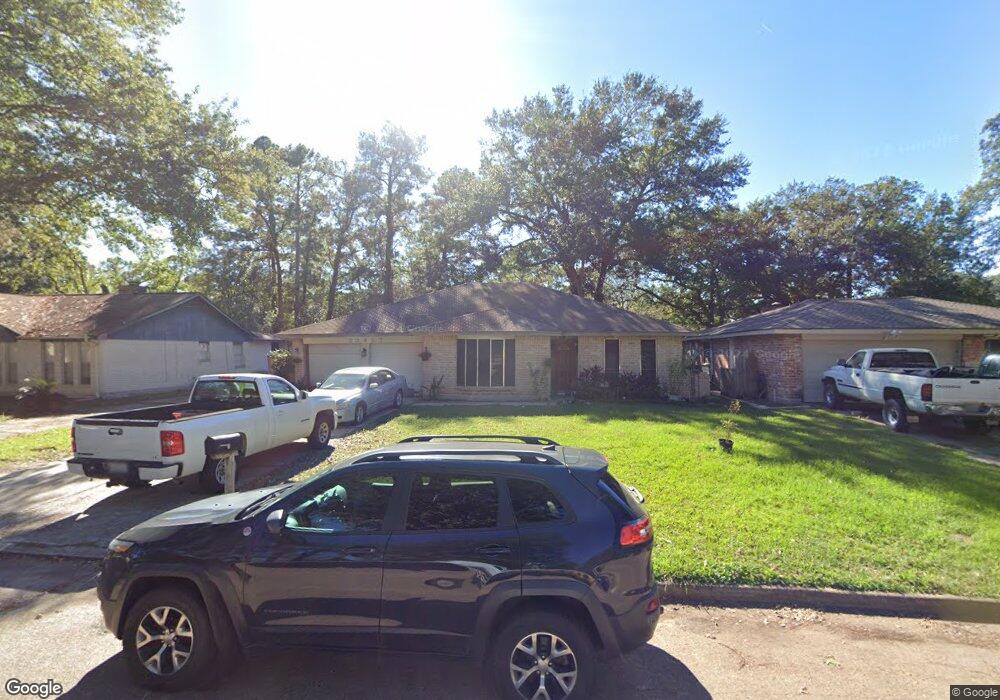
23427 Harpergate Dr Spring, TX 77373
Estimated Value: $194,000 - $227,000
3
Beds
2
Baths
1,646
Sq Ft
$126/Sq Ft
Est. Value
About This Home
This home is located at 23427 Harpergate Dr, Spring, TX 77373 and is currently estimated at $206,788, approximately $125 per square foot. 23427 Harpergate Dr is a home located in Harris County with nearby schools including Mildred Jenkins Elementary School, Dueitt Middle School, and Spring High School.
Ownership History
Date
Name
Owned For
Owner Type
Purchase Details
Closed on
Mar 13, 2013
Sold by
Vistamont Realty Management Inc
Bought by
Lopez Arturo Torres and Baines Shantae Lanell
Current Estimated Value
Purchase Details
Closed on
Dec 28, 2009
Sold by
Federal Home Loan Mortgage Corporation
Bought by
Vistamont Realty Management Inc
Purchase Details
Closed on
Jan 7, 2008
Sold by
Placencia Jazel A and Placencia Araceli
Bought by
Federal Home Loan Mortgage Corporation
Purchase Details
Closed on
Apr 16, 2004
Sold by
Lilley Andre Clifford and Lilley Jeannie Rae
Bought by
Placencia Jezael A
Home Financials for this Owner
Home Financials are based on the most recent Mortgage that was taken out on this home.
Original Mortgage
$71,920
Interest Rate
7.75%
Mortgage Type
Purchase Money Mortgage
Create a Home Valuation Report for This Property
The Home Valuation Report is an in-depth analysis detailing your home's value as well as a comparison with similar homes in the area
Home Values in the Area
Average Home Value in this Area
Purchase History
| Date | Buyer | Sale Price | Title Company |
|---|---|---|---|
| Lopez Arturo Torres | -- | None Available | |
| Vistamont Realty Management Inc | -- | Fidelity National Title | |
| Federal Home Loan Mortgage Corporation | $82,000 | None Available | |
| Placencia Jezael A | -- | American Title Company |
Source: Public Records
Mortgage History
| Date | Status | Borrower | Loan Amount |
|---|---|---|---|
| Previous Owner | Placencia Jezael A | $71,920 | |
| Closed | Placencia Jezael A | $17,980 | |
| Closed | Lopez Arturo Torres | $0 |
Source: Public Records
Tax History
| Year | Tax Paid | Tax Assessment Tax Assessment Total Assessment is a certain percentage of the fair market value that is determined by local assessors to be the total taxable value of land and additions on the property. | Land | Improvement |
|---|---|---|---|---|
| 2025 | $5,439 | $216,044 | $37,950 | $178,094 |
| 2024 | $5,439 | $217,327 | $37,950 | $179,377 |
| 2023 | $5,439 | $219,405 | $37,950 | $181,455 |
| 2022 | $3,918 | $200,441 | $37,950 | $162,491 |
| 2021 | $3,774 | $156,365 | $21,450 | $134,915 |
| 2020 | $3,663 | $145,714 | $21,450 | $124,264 |
| 2019 | $3,452 | $140,537 | $14,850 | $125,687 |
| 2018 | $2,530 | $125,944 | $14,850 | $111,094 |
| 2017 | $2,821 | $125,944 | $14,850 | $111,094 |
| 2016 | $2,564 | $111,292 | $14,850 | $96,442 |
| 2015 | $1,827 | $101,938 | $14,850 | $87,088 |
| 2014 | $1,827 | $74,287 | $14,850 | $59,437 |
Source: Public Records
Map
Nearby Homes
- 4322 Towergate Dr
- 4330 Tylergate Dr
- 4519 Tylergate Dr
- 4310 Towergate Dr
- 4431 Enchantedgate Dr
- 4527 Adonis Dr
- 4307 Sloangate Dr
- 4310 Enchantedgate Dr
- 4303 Chestergate Dr
- 4551 Algernon Dr
- 23430 Wintergate Dr
- 4411 Monteith Dr
- 4318 Burkegate Dr
- 23202 Summergate Dr
- 4127 Adonis Dr
- 26114 Halwell Manor Ln
- 23127 Harpergate Dr
- 23122 Cimber Ln
- 23123 Lestergate Dr
- 4606 Fitzwater Dr
- 23431 Harpergate Dr
- 23423 Harpergate Dr
- 23426 Lestergate Dr
- 23503 Harpergate Dr
- 23430 Lestergate Dr
- 23422 Lestergate Dr
- 23419 Harpergate Dr
- 23434 Lestergate Dr
- 23418 Lestergate Dr
- 23426 Harpergate Dr
- 23430 Harpergate Dr
- 23507 Harpergate Dr
- 23422 Harpergate Dr
- 23502 Harpergate Dr
- 23415 Harpergate Dr
- 23414 Lestergate Dr
- 23418 Harpergate Dr
- 23506 Harpergate Dr
- 4335 Towergate Dr
- 23511 Harpergate Dr
Your Personal Tour Guide
Ask me questions while you tour the home.