2343 Bob White Ct SE Grand Rapids, MI 49546
Estimated Value: $411,710 - $498,000
2
Beds
3
Baths
1
Sq Ft
$472,678/Sq Ft
Est. Value
About This Home
This home is located at 2343 Bob White Ct SE, Grand Rapids, MI 49546 and is currently estimated at $472,678, approximately $472,678 per square foot. 2343 Bob White Ct SE is a home located in Kent County with nearby schools including Meadow Brook Elementary School, Northern Trails 5/6 School, and Northern Hills Middle School.
Ownership History
Date
Name
Owned For
Owner Type
Purchase Details
Closed on
Dec 20, 2021
Sold by
Marie Gilewski
Bought by
Gilewski Marie
Current Estimated Value
Purchase Details
Closed on
Feb 24, 2020
Sold by
Krampe Michael N and Salik Jessica L
Bought by
Gilewski Marie
Purchase Details
Closed on
Jul 9, 2019
Sold by
Krampe Kristine
Bought by
Krampe Kristine and Krampe Michael N
Purchase Details
Closed on
May 3, 2017
Sold by
Hasenyager Patricia A
Bought by
Krampe Kristine
Home Financials for this Owner
Home Financials are based on the most recent Mortgage that was taken out on this home.
Original Mortgage
$185,250
Interest Rate
4.23%
Mortgage Type
New Conventional
Purchase Details
Closed on
Jul 6, 1995
Bought by
Hasenyager Patricia A and Hasenyager Patricia A
Purchase Details
Closed on
Aug 17, 1994
Bought by
Hasenyager Helmer and Hasenyager Patricia A
Purchase Details
Closed on
Apr 1, 1993
Bought by
Mi Ins Commissioner and Hasenyager Patricia A
Create a Home Valuation Report for This Property
The Home Valuation Report is an in-depth analysis detailing your home's value as well as a comparison with similar homes in the area
Home Values in the Area
Average Home Value in this Area
Purchase History
| Date | Buyer | Sale Price | Title Company |
|---|---|---|---|
| Gilewski Marie | -- | None Listed On Document | |
| Gilewski Marie | $365,000 | Ata National Title Group Llc | |
| Krampe Kristine | -- | None Available | |
| Krampe Kristine | $249,000 | Midstate Title Agency Llc | |
| Hasenyager Patricia A | $165,000 | -- | |
| Hasenyager Helmer | $158,000 | -- | |
| Mi Ins Commissioner | -- | -- |
Source: Public Records
Mortgage History
| Date | Status | Borrower | Loan Amount |
|---|---|---|---|
| Previous Owner | Krampe Kristine | $185,250 |
Source: Public Records
Tax History Compared to Growth
Tax History
| Year | Tax Paid | Tax Assessment Tax Assessment Total Assessment is a certain percentage of the fair market value that is determined by local assessors to be the total taxable value of land and additions on the property. | Land | Improvement |
|---|---|---|---|---|
| 2025 | $3,327 | $191,700 | $0 | $0 |
| 2024 | $3,327 | $183,600 | $0 | $0 |
| 2023 | $4,658 | $157,800 | $0 | $0 |
| 2022 | $4,507 | $148,600 | $0 | $0 |
| 2021 | $4,400 | $139,600 | $0 | $0 |
| 2020 | $2,677 | $136,500 | $0 | $0 |
| 2019 | $3,935 | $130,300 | $0 | $0 |
| 2018 | $3,884 | $118,900 | $0 | $0 |
| 2017 | $2,725 | $102,200 | $0 | $0 |
| 2016 | $2,631 | $99,700 | $0 | $0 |
| 2015 | -- | $99,700 | $0 | $0 |
| 2013 | -- | $78,500 | $0 | $0 |
Source: Public Records
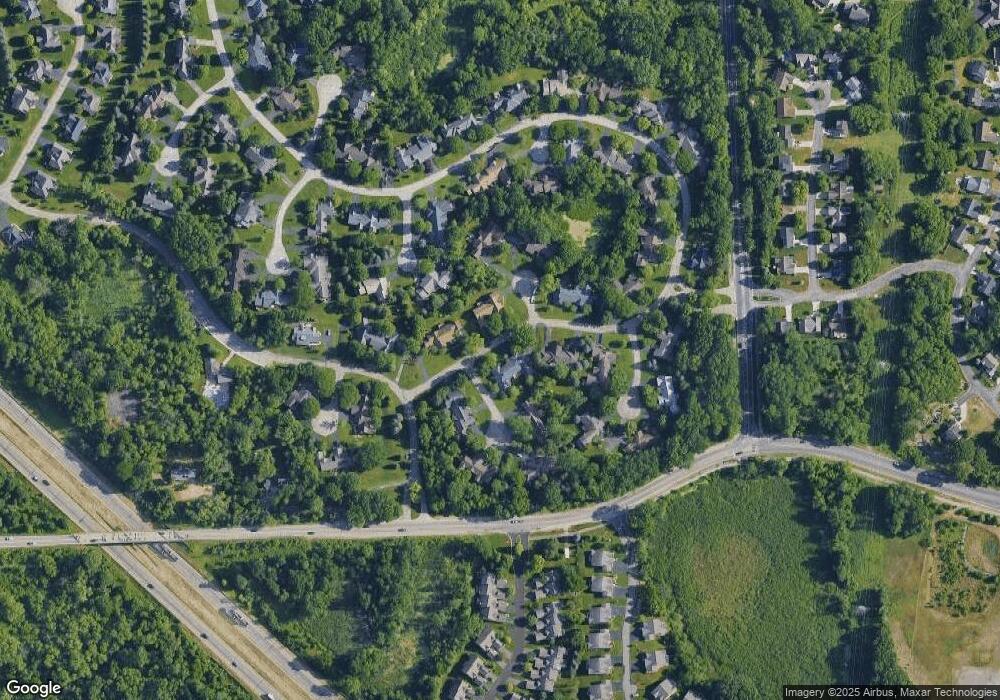
Map
Nearby Homes
- 2376 Bob White Ct SE
- 2322 Pheasant Ct SE Unit 17
- 2462 Highridge Ln SE
- 2242 Christine Ct SE
- 4875 N Quail Crest Dr SE
- 2033 Talamore Ct SE
- 1909 Deerfield Ct SE
- 4478 Burton Forest Ct SE
- 4496 Shiloh Way Dr SE
- 1878 Watermark Dr SE
- 2521 Chatham Woods Dr SE Unit 36
- 1674 Riva Ridge Dr SE
- 2630 Chatham Woods Dr SE Unit 1
- 2657 Chatham Woods Dr SE Unit 21
- 2570 Knightsbridge Rd SE Unit 63
- 2594 Talltimber Ct
- V/L 2124 Engleside Ave SE
- 1598 MacNider Ave SE
- 4107 S Norway St SE Unit 72
- 1919 Thorn Run Ct SE Unit 32
- 2343 Bob White Ct SE Unit 33
- 2345 Bob White Ct SE
- 2347 Bob White Ct SE
- 2344 Bob White Ct SE
- 5104 S Quail Crest Dr SE Unit 43
- 2350 Bob White Ct SE Unit 37
- 2373 Bob White Ct SE
- 5079 S Quail Crest Dr SE
- 2354 Bob White Ct SE
- 2377 Bob White Ct SE
- 2377 Bob White Ct SE Unit 46
- 5073 S Quail Crest Dr SE
- 5073 S Quail Crest Dr SE Unit 39
- 5106 S Quail Crest Dr SE Unit V44
- 5069 S Quail Crest Dr SE Unit 38
- 5089 S Quail Crest Dr SE
- 2376 Bob White Ct SE Unit 87
- 2374 Bob White Ct SE
- 2374 Bob White Ct SE Unit 86
- 5091 S Quail Crest Dr SE Unit 22