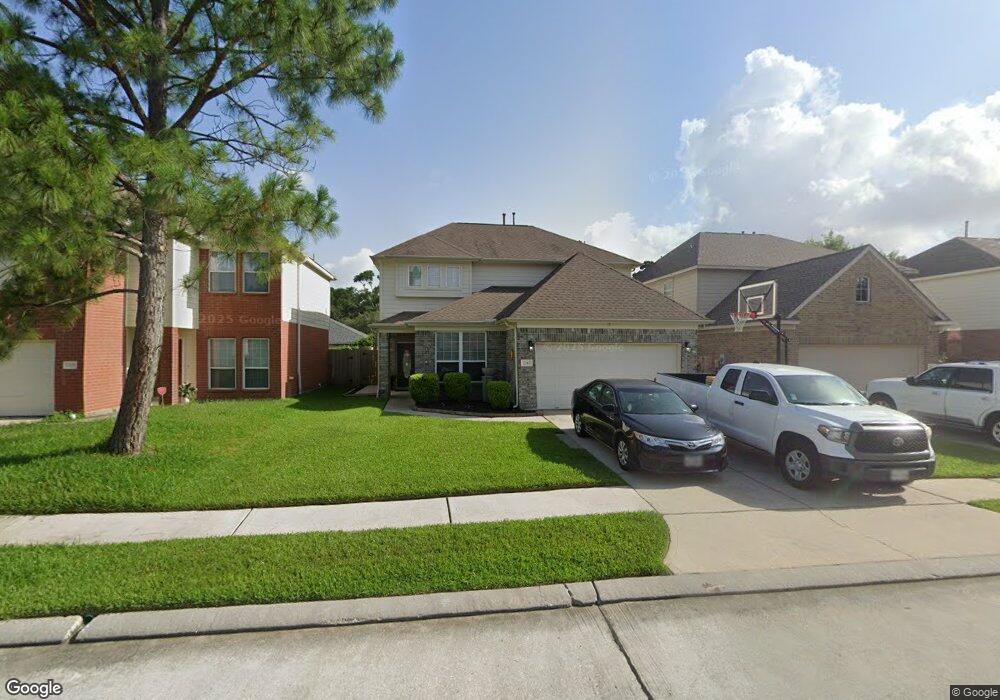
2343 Urban Forest Ct Spring, TX 77386
Estimated Value: $275,000 - $309,000
--
Bed
1
Bath
2,545
Sq Ft
$114/Sq Ft
Est. Value
About This Home
This home is located at 2343 Urban Forest Ct, Spring, TX 77386 and is currently estimated at $289,244, approximately $113 per square foot. 2343 Urban Forest Ct is a home located in Montgomery County with nearby schools including A. Davis Ford Elementary School, Vogel Intermediate School, and Irons J High School.
Ownership History
Date
Name
Owned For
Owner Type
Purchase Details
Closed on
Feb 26, 2016
Sold by
Orozco Monty E
Bought by
Orozco Josh E and Orozco Elizabeth
Current Estimated Value
Home Financials for this Owner
Home Financials are based on the most recent Mortgage that was taken out on this home.
Original Mortgage
$122,200
Outstanding Balance
$96,721
Interest Rate
3.65%
Mortgage Type
New Conventional
Estimated Equity
$192,523
Purchase Details
Closed on
Feb 3, 2015
Sold by
Orozco Joshua Eric
Bought by
Orozco Monty Eden
Purchase Details
Closed on
Apr 20, 2010
Sold by
Orozco Monty Eden
Bought by
Orozco Joshua Eric
Purchase Details
Closed on
Nov 20, 2007
Sold by
Long Lake Ltd
Bought by
Orozco Monty E
Home Financials for this Owner
Home Financials are based on the most recent Mortgage that was taken out on this home.
Original Mortgage
$137,956
Interest Rate
6.42%
Mortgage Type
Purchase Money Mortgage
Create a Home Valuation Report for This Property
The Home Valuation Report is an in-depth analysis detailing your home's value as well as a comparison with similar homes in the area
Home Values in the Area
Average Home Value in this Area
Purchase History
| Date | Buyer | Sale Price | Title Company |
|---|---|---|---|
| Orozco Josh E | -- | None Available | |
| Orozco Monty Eden | -- | None Available | |
| Orozco Joshua Eric | -- | None Available | |
| Orozco Monty E | -- | American Title Co |
Source: Public Records
Mortgage History
| Date | Status | Borrower | Loan Amount |
|---|---|---|---|
| Open | Orozco Josh E | $122,200 | |
| Closed | Orozco Monty E | $137,956 |
Source: Public Records
Tax History Compared to Growth
Tax History
| Year | Tax Paid | Tax Assessment Tax Assessment Total Assessment is a certain percentage of the fair market value that is determined by local assessors to be the total taxable value of land and additions on the property. | Land | Improvement |
|---|---|---|---|---|
| 2025 | $3,352 | $316,949 | $42,500 | $274,449 |
| 2024 | $4,822 | $291,500 | -- | -- |
| 2023 | $4,822 | $265,000 | $42,500 | $222,500 |
| 2022 | $7,752 | $293,060 | $42,500 | $250,560 |
| 2021 | $6,209 | $220,280 | $42,500 | $177,780 |
| 2020 | $6,205 | $210,770 | $23,630 | $187,140 |
| 2019 | $5,992 | $198,780 | $23,630 | $175,150 |
| 2018 | $5,478 | $181,730 | $23,630 | $158,100 |
| 2017 | $5,473 | $181,730 | $23,630 | $158,100 |
| 2016 | $5,473 | $181,730 | $23,630 | $158,100 |
| 2015 | $4,506 | $175,520 | $23,630 | $151,890 |
| 2014 | $4,506 | $148,620 | $23,630 | $124,990 |
Source: Public Records
Map
Nearby Homes
- 2335 Village Leaf Dr
- 29526 Winton Wood Way
- 29518 Timber Trail St
- 2402 Fawnwood Ln
- 2306 Garden Square Path
- 2269 Garden Square Path
- 2511 Leichester Dr
- 29318 Waltham St
- 29803 Spring Forest Dr
- 29506 Stapleford St
- 29610 Loddington St
- 29475 Forest Floor Ln
- 29823 Spring Terrace Dr
- 29322 Fair Sky Trail
- 29514 Loddington St
- 29474 Forest Floor Ln
- 29835 Spring Terrace Dr
- 29819 Sparkling Creek Dr
- 29818 E Hawthorne Dr
- 29464 Graceful Path Way
- 2347 Urban Forest Ct
- 2339 Urban Forest Ct
- 2351 Urban Forest Ct
- 2335 Urban Forest Ct
- 2350 Village Leaf Dr
- 2346 Village Leaf Dr
- 2354 Village Leaf Dr
- 2355 Urban Forest Ct
- 2331 Urban Forest Ct
- 2342 Village Leaf Dr
- 2358 Village Leaf Dr
- 2346 Urban Forest Ct
- 2342 Urban Forest Ct
- 2350 Urban Forest Ct
- 2338 Urban Forest Ct
- 2338 Village Leaf Dr
- 2362 Village Leaf Dr
- 2359 Urban Forest Ct
- 2327 Urban Forest Ct
- 2354 Urban Forest Ct