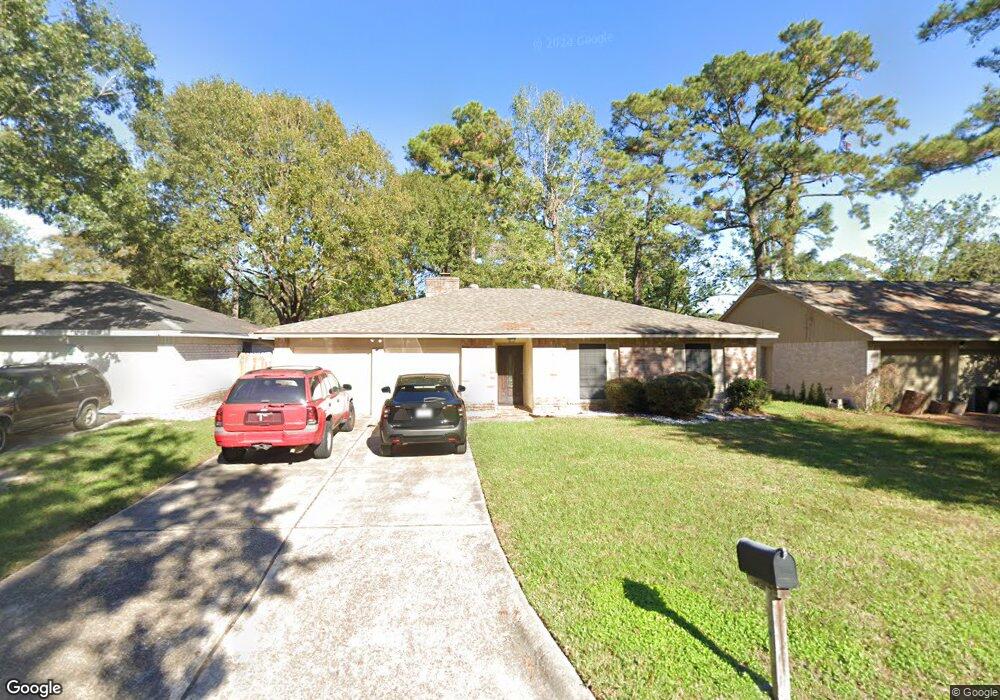
23430 Harpergate Dr Spring, TX 77373
Estimated Value: $195,372 - $201,000
4
Beds
2
Baths
1,480
Sq Ft
$134/Sq Ft
Est. Value
About This Home
This home is located at 23430 Harpergate Dr, Spring, TX 77373 and is currently estimated at $198,343, approximately $134 per square foot. 23430 Harpergate Dr is a home located in Harris County with nearby schools including Mildred Jenkins Elementary School, Dueitt Middle School, and Spring High School.
Ownership History
Date
Name
Owned For
Owner Type
Purchase Details
Closed on
Jul 15, 2011
Sold by
Brice Jennifer A
Bought by
Linden Pamelia C
Current Estimated Value
Home Financials for this Owner
Home Financials are based on the most recent Mortgage that was taken out on this home.
Original Mortgage
$73,098
Outstanding Balance
$50,675
Interest Rate
4.75%
Mortgage Type
FHA
Estimated Equity
$147,668
Purchase Details
Closed on
Mar 8, 1995
Sold by
Hud
Bought by
Brice Jennifer A
Home Financials for this Owner
Home Financials are based on the most recent Mortgage that was taken out on this home.
Original Mortgage
$46,012
Interest Rate
9.04%
Mortgage Type
FHA
Purchase Details
Closed on
Aug 2, 1994
Sold by
Pipes Suzann P
Bought by
Merrill Lynch Credit Corp
Create a Home Valuation Report for This Property
The Home Valuation Report is an in-depth analysis detailing your home's value as well as a comparison with similar homes in the area
Home Values in the Area
Average Home Value in this Area
Purchase History
We collect this data history from publicly available records. To have your information removed, we recommend requesting removal directly through your county’s website.
| Date | Buyer | Sale Price | Title Company |
|---|---|---|---|
| Linden Pamelia C | -- | Great American Title Company | |
| Brice Jennifer A | $46,395 | -- | |
| Merrill Lynch Credit Corp | -- | -- | |
| Hud | -- | -- |
Source: Public Records
Mortgage History
We collect this data history from publicly available records. To have your information removed, we recommend requesting removal directly through your county’s website.
| Date | Status | Borrower | Loan Amount |
|---|---|---|---|
| Open | Linden Pamelia C | $73,098 | |
| Previous Owner | Brice Jennifer A | $46,012 |
Source: Public Records
Tax History
| Year | Tax Paid | Tax Assessment Tax Assessment Total Assessment is a certain percentage of the fair market value that is determined by local assessors to be the total taxable value of land and additions on the property. | Land | Improvement |
|---|---|---|---|---|
| 2025 | $670 | $194,483 | $37,950 | $156,533 |
| 2024 | $670 | $195,614 | $37,950 | $157,664 |
| 2023 | $670 | $197,437 | $37,950 | $159,487 |
| 2022 | $3,161 | $180,803 | $37,950 | $142,853 |
| 2021 | $3,045 | $140,074 | $21,450 | $118,624 |
| 2020 | $2,956 | $134,656 | $21,450 | $113,206 |
| 2019 | $2,785 | $129,361 | $14,850 | $114,511 |
| 2018 | $157 | $116,061 | $14,850 | $101,211 |
| 2017 | $2,276 | $116,061 | $14,850 | $101,211 |
| 2016 | $2,069 | $102,703 | $14,850 | $87,853 |
| 2015 | $368 | $94,190 | $14,850 | $79,340 |
| 2014 | $368 | $0 | $0 | $0 |
Source: Public Records
Map
Nearby Homes
- 4610 Sloangate Dr
- 23403 Cimber Ln
- 4330 Tylergate Dr
- 4307 Sloangate Dr
- 4431 Enchantedgate Dr
- 4425 Algernon Dr
- 4303 Chestergate Dr
- 4550 Chestergate Dr
- 23322 Birnam Wood Blvd
- 4311 Enchantedgate Dr
- 4318 Burkegate Dr
- 4506 Algernon Dr
- 23430 Wintergate Dr
- 4542 Algernon Dr
- 4538 Burkegate Dr
- 3331 Forest Chitto Dr
- 23127 Harpergate Dr
- 4423 Mossygate Dr
- 22446 Gilded Peak Ln
- 4606 Fitzwater Dr
- 23502 Harpergate Dr
- 23426 Harpergate Dr
- 23431 Cimber Ln
- 23506 Harpergate Dr
- 23427 Cimber Ln
- 23503 Cimber Ln
- 23422 Harpergate Dr
- 23423 Cimber Ln
- 23507 Cimber Ln
- 23431 Harpergate Dr
- 23427 Harpergate Dr
- 23510 Harpergate Dr
- 23418 Harpergate Dr
- 23503 Harpergate Dr
- 23423 Harpergate Dr
- 23419 Cimber Ln
- 23511 Cimber Ln
- 23507 Harpergate Dr
- 23514 Harpergate Dr
- 23414 Harpergate Dr
Your Personal Tour Guide
Ask me questions while you tour the home.