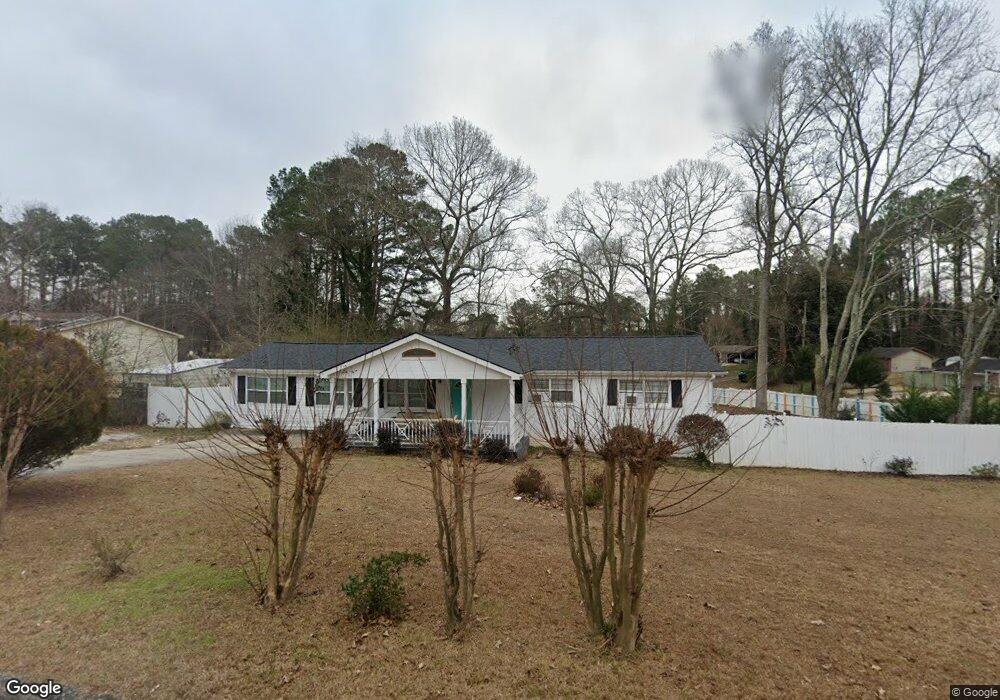
2344 Chestnut Log Place Unit 4 Lithia Springs, GA 30122
Lithia Springs NeighborhoodEstimated Value: $196,000 - $244,250
3
Beds
2
Baths
1,520
Sq Ft
$149/Sq Ft
Est. Value
About This Home
This home is located at 2344 Chestnut Log Place Unit 4, Lithia Springs, GA 30122 and is currently estimated at $226,063, approximately $148 per square foot. 2344 Chestnut Log Place Unit 4 is a home located in Douglas County with nearby schools including Sweetwater Elementary School, Factory Shoals Middle School, and Lithia Springs Comprehensive High School.
Ownership History
Date
Name
Owned For
Owner Type
Purchase Details
Closed on
Jun 29, 2006
Sold by
Cortes Eduardo
Bought by
Johnson Karen
Current Estimated Value
Home Financials for this Owner
Home Financials are based on the most recent Mortgage that was taken out on this home.
Original Mortgage
$75,600
Outstanding Balance
$44,683
Interest Rate
6.57%
Mortgage Type
New Conventional
Estimated Equity
$181,380
Purchase Details
Closed on
Oct 15, 2001
Sold by
Applewhite Ronald T and Applewhite Christie L
Bought by
Cortes Eduardo
Home Financials for this Owner
Home Financials are based on the most recent Mortgage that was taken out on this home.
Original Mortgage
$80,692
Interest Rate
6.85%
Mortgage Type
FHA
Purchase Details
Closed on
Mar 7, 1996
Sold by
Hud
Bought by
Applewhite Ronald Christie
Purchase Details
Closed on
Sep 5, 1995
Sold by
Citizens Mtg Corp
Bought by
Hud
Create a Home Valuation Report for This Property
The Home Valuation Report is an in-depth analysis detailing your home's value as well as a comparison with similar homes in the area
Home Values in the Area
Average Home Value in this Area
Purchase History
| Date | Buyer | Sale Price | Title Company |
|---|---|---|---|
| Johnson Karen | $84,000 | -- | |
| Cortes Eduardo | $82,000 | -- | |
| Applewhite Ronald Christie | -- | -- | |
| Hud | -- | -- | |
| Citizens Mtg Corp Anita G | $53,000 | -- |
Source: Public Records
Mortgage History
| Date | Status | Borrower | Loan Amount |
|---|---|---|---|
| Open | Johnson Karen | $75,600 | |
| Previous Owner | Cortes Eduardo | $80,692 | |
| Closed | Applewhite Ronald Christie | $0 |
Source: Public Records
Tax History Compared to Growth
Tax History
| Year | Tax Paid | Tax Assessment Tax Assessment Total Assessment is a certain percentage of the fair market value that is determined by local assessors to be the total taxable value of land and additions on the property. | Land | Improvement |
|---|---|---|---|---|
| 2024 | $2,648 | $84,160 | $18,000 | $66,160 |
| 2023 | $2,648 | $84,160 | $18,000 | $66,160 |
| 2022 | $1,498 | $59,760 | $18,000 | $41,760 |
| 2021 | $1,185 | $44,000 | $12,000 | $32,000 |
| 2020 | $1,209 | $44,000 | $12,000 | $32,000 |
| 2019 | $1,029 | $33,240 | $9,240 | $24,000 |
| 2018 | $872 | $28,040 | $8,040 | $20,000 |
| 2017 | $815 | $25,680 | $8,040 | $17,640 |
| 2016 | $959 | $29,720 | $9,600 | $20,120 |
| 2015 | $849 | $25,760 | $8,520 | $17,240 |
| 2014 | $829 | $24,676 | $8,640 | $16,036 |
| 2013 | -- | $27,080 | $9,600 | $17,480 |
Source: Public Records
Map
Nearby Homes
- 2322 Chestnut Log Loop
- 2275 Chestnut Log Loop
- 1940 Lee
- 2499 Chestnut Log Loop
- 3570 Briar Dr
- 1815 Lee Rd
- 2087 Chestnut Way
- 8684 Hickory Ln
- LOT 27 Chestnut Ln
- 3646 Briar Dr
- 2182 Ann Ln
- 3652 Sweetbriar Cir
- 3686 Sweetbriar Cir
- 2344 Mount Vernon Rd
- 2436 Falls River Dr
- 3790 Sweetbriar Cir
- 3460 Meadowview Dr
- HAYDEN Plan at Fairhaven
- GREEN Plan at Fairhaven
- CALI Plan at Fairhaven
- 2328 Chestnut Log Place
- 2321 Chestnut Log Loop
- 2350 Chestnut Log Loop
- 2341 Chestnut Log Place Unit 4
- 2314 Chestnut Log Place Unit 137
- 2314 Chestnut Log Place
- 2340 Chestnut Log Loop Unit 4
- 2331 Chestnut Log Place
- 2349 Chestnut Log Loop
- 2360 Chestnut Log Loop
- 2171 Highridge Point Dr
- 2330 Chestnut Log Loop
- 2309 Chestnut Log Loop
- 2322 Chestnut Log Loop Unit 2322
- 2323 Chestnut Log Place Unit 4
- 2372 Chestnut Log Loop
- 2369 Chestnut Log Ct Unit 4
- 2365 Chestnut Log Loop
- 2310 Chestnut Log Place
- 2305 Chestnut Log Place