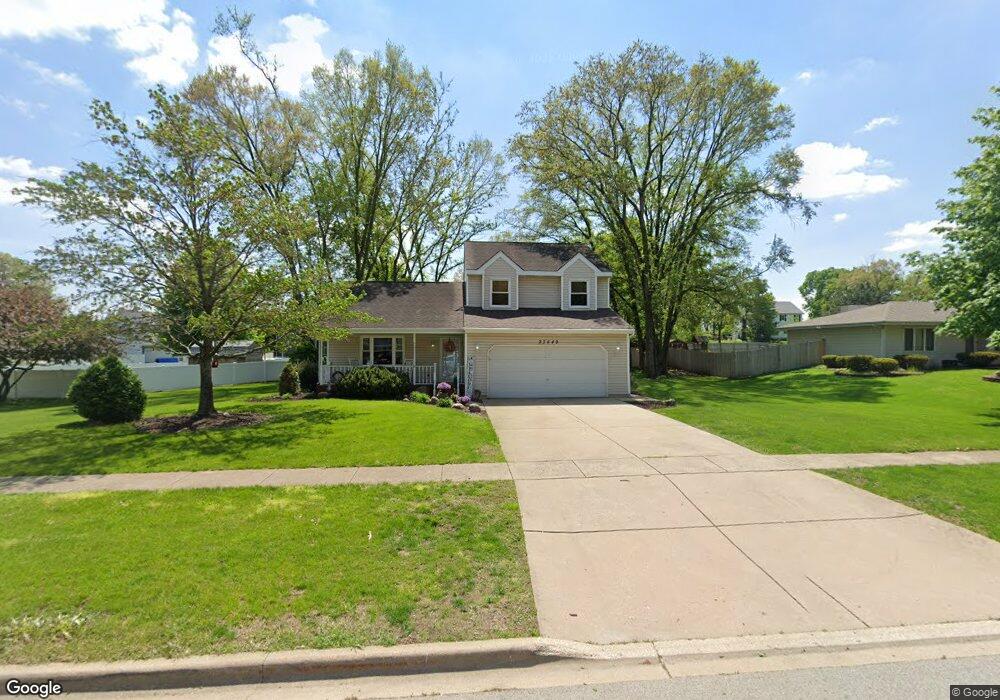
23449 W Mcclintock Rd Channahon, IL 60410
Southwest Joliet NeighborhoodEstimated Value: $334,000 - $415,000
3
Beds
3
Baths
1,568
Sq Ft
$237/Sq Ft
Est. Value
About This Home
This home is located at 23449 W Mcclintock Rd, Channahon, IL 60410 and is currently estimated at $371,677, approximately $237 per square foot. 23449 W Mcclintock Rd is a home located in Will County with nearby schools including Heritage Trail Elementary School, Troy Middle School, and Orenic Intermediate School.
Ownership History
Date
Name
Owned For
Owner Type
Purchase Details
Closed on
Jun 10, 2009
Sold by
Mitchell Scott M and Mitchell Nanci
Bought by
Mitchell Scott M and Mitchell Nanci A
Current Estimated Value
Home Financials for this Owner
Home Financials are based on the most recent Mortgage that was taken out on this home.
Original Mortgage
$219,983
Outstanding Balance
$140,109
Interest Rate
4.92%
Mortgage Type
FHA
Estimated Equity
$231,568
Purchase Details
Closed on
Jul 10, 2007
Sold by
Coward Jeff A and Qualls Rona R
Bought by
Mitchell Scott M
Home Financials for this Owner
Home Financials are based on the most recent Mortgage that was taken out on this home.
Original Mortgage
$213,000
Interest Rate
6.79%
Mortgage Type
Purchase Money Mortgage
Purchase Details
Closed on
Aug 27, 1999
Sold by
Huyhn Tim Kim
Bought by
Cowart Jeff A and Cowart Rona R
Home Financials for this Owner
Home Financials are based on the most recent Mortgage that was taken out on this home.
Original Mortgage
$125,300
Interest Rate
7.77%
Create a Home Valuation Report for This Property
The Home Valuation Report is an in-depth analysis detailing your home's value as well as a comparison with similar homes in the area
Home Values in the Area
Average Home Value in this Area
Purchase History
| Date | Buyer | Sale Price | Title Company |
|---|---|---|---|
| Mitchell Scott M | -- | Chicago Title Insurance Co | |
| Mitchell Scott M | $213,000 | First American Title | |
| Cowart Jeff A | $161,000 | Djh Title & Abstract |
Source: Public Records
Mortgage History
| Date | Status | Borrower | Loan Amount |
|---|---|---|---|
| Open | Mitchell Scott M | $219,983 | |
| Previous Owner | Mitchell Scott M | $213,000 | |
| Previous Owner | Cowart Jeff A | $125,300 |
Source: Public Records
Tax History Compared to Growth
Tax History
| Year | Tax Paid | Tax Assessment Tax Assessment Total Assessment is a certain percentage of the fair market value that is determined by local assessors to be the total taxable value of land and additions on the property. | Land | Improvement |
|---|---|---|---|---|
| 2024 | $8,251 | $99,150 | $20,464 | $78,686 |
| 2023 | $8,251 | $89,083 | $18,386 | $70,697 |
| 2022 | $7,437 | $84,295 | $17,398 | $66,897 |
| 2021 | $7,437 | $79,299 | $16,367 | $62,932 |
| 2020 | $7,009 | $79,299 | $16,367 | $62,932 |
| 2019 | $6,800 | $76,066 | $15,700 | $60,366 |
| 2018 | $6,787 | $75,166 | $15,700 | $59,466 |
| 2017 | $6,720 | $73,100 | $15,700 | $57,400 |
| 2016 | $6,460 | $68,950 | $15,700 | $53,250 |
| 2015 | $5,542 | $63,400 | $14,250 | $49,150 |
| 2014 | $5,542 | $61,085 | $14,250 | $46,835 |
| 2013 | $5,542 | $61,085 | $14,250 | $46,835 |
Source: Public Records
Map
Nearby Homes
- 22825 S Patricia Ln
- 23040 S Patricia Ln
- 22524 S Deal Ave
- 22456 S Lakepoint Ct
- 22538 S Remington Dr
- 23722 Lakepoint Dr
- 22419 S Joseph Ave
- 22344 S Donna Ave
- 22140 SW Frontage Rd
- 4265 Mound Rd
- 24349 W Camelot Rd
- 22416 S Kings Ct
- 24317 Schubert Ln
- 24205 S Edwin Dr
- 24412 W Park River Ln
- 23550 S Vetter Rd
- 24409 W Park River Ln
- 23959 S Green Heron Dr
- 24123 S Sandpiper Dr
- 24721 W Park River Ln
- 23459 W Mcclintock Rd
- 23433 W Mcclintock Rd
- 22746 S Michael Dr
- 22758 S Michael Dr
- 23454 W Mcclintock Rd
- 23501 W Mcclintock Rd
- 22800 S Michael Dr
- 23440 W Mcclintock Rd
- 23506 W Mcclintock Rd
- 23425 W Mcclintock Rd
- 23505 W Mcclintock Rd
- 23516 W Mcclintock Rd
- 22808 S Michael Dr
- 23526 W Mcclintock Rd
- 23408 S Kathey Dr
- 22761 S Michael Dr
- 23513 W Mcclintock Rd
- 22816 S Michael Dr Unit 3
- 23407 W Mcclintock Rd
- 22815 S Anna Dr