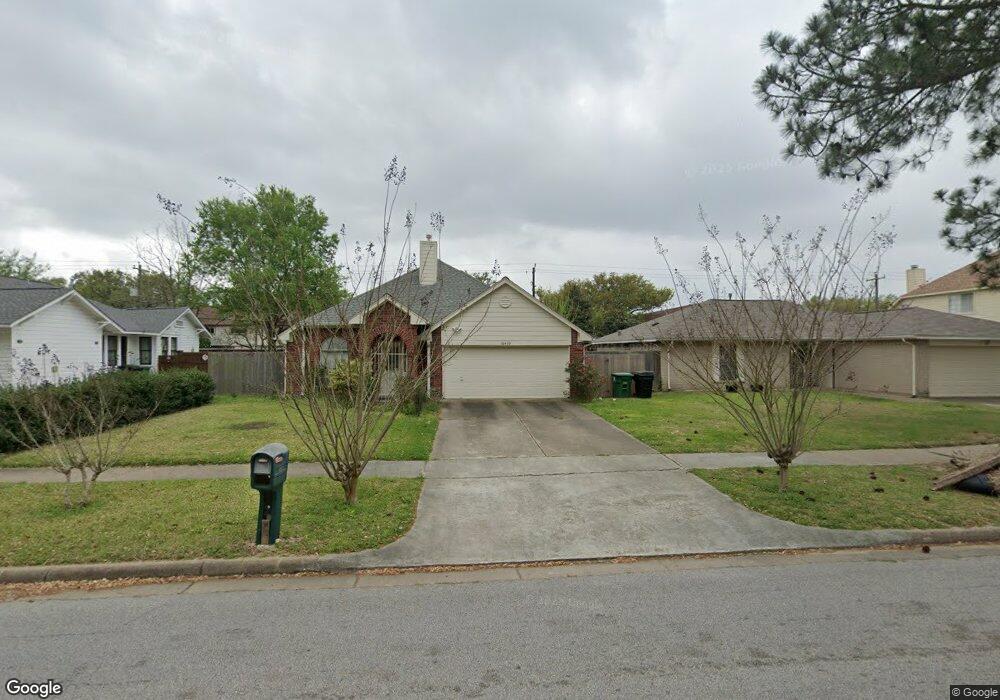
2345 Triway Ln Unit 218 Houston, TX 77043
Spring Shadows NeighborhoodEstimated Value: $185,000 - $282,000
2
Beds
3
Baths
1,452
Sq Ft
$148/Sq Ft
Est. Value
About This Home
This home is located at 2345 Triway Ln Unit 218, Houston, TX 77043 and is currently estimated at $214,916, approximately $148 per square foot. 2345 Triway Ln Unit 218 is a home located in Harris County with nearby schools including Westwood Elementary School, Spring Oaks Middle School, and Spring Woods High School.
Ownership History
Date
Name
Owned For
Owner Type
Purchase Details
Closed on
Dec 19, 2008
Sold by
Casarez Emilio
Bought by
Varela Patricia
Current Estimated Value
Home Financials for this Owner
Home Financials are based on the most recent Mortgage that was taken out on this home.
Original Mortgage
$32,000
Outstanding Balance
$21,206
Interest Rate
6.19%
Mortgage Type
Purchase Money Mortgage
Estimated Equity
$193,710
Purchase Details
Closed on
Dec 5, 2005
Sold by
Martinez Luis M
Bought by
Casarez Emilio
Home Financials for this Owner
Home Financials are based on the most recent Mortgage that was taken out on this home.
Original Mortgage
$58,000
Interest Rate
6.29%
Mortgage Type
Fannie Mae Freddie Mac
Purchase Details
Closed on
Dec 3, 2004
Sold by
Martinez Sophie Decaro
Bought by
Martinez Luis M
Purchase Details
Closed on
Nov 2, 2001
Sold by
Shivers Jesse E
Bought by
Martinez Luis M
Home Financials for this Owner
Home Financials are based on the most recent Mortgage that was taken out on this home.
Original Mortgage
$50,400
Interest Rate
6.71%
Create a Home Valuation Report for This Property
The Home Valuation Report is an in-depth analysis detailing your home's value as well as a comparison with similar homes in the area
Home Values in the Area
Average Home Value in this Area
Purchase History
| Date | Buyer | Sale Price | Title Company |
|---|---|---|---|
| Varela Patricia | -- | Ameripoint Title | |
| Casarez Emilio | -- | Fidelity National Title | |
| Martinez Luis M | -- | -- | |
| Martinez Luis M | -- | -- |
Source: Public Records
Mortgage History
| Date | Status | Borrower | Loan Amount |
|---|---|---|---|
| Open | Varela Patricia | $32,000 | |
| Previous Owner | Casarez Emilio | $58,000 | |
| Previous Owner | Martinez Luis M | $50,400 |
Source: Public Records
Tax History Compared to Growth
Tax History
| Year | Tax Paid | Tax Assessment Tax Assessment Total Assessment is a certain percentage of the fair market value that is determined by local assessors to be the total taxable value of land and additions on the property. | Land | Improvement |
|---|---|---|---|---|
| 2025 | $1,701 | $171,000 | $60,000 | $111,000 |
| 2024 | $1,701 | $157,503 | $60,000 | $97,503 |
| 2023 | $1,701 | $161,709 | $60,000 | $101,709 |
| 2022 | $3,739 | $154,307 | $60,000 | $94,307 |
| 2021 | $3,404 | $139,434 | $50,000 | $89,434 |
| 2020 | $3,342 | $137,129 | $50,000 | $87,129 |
| 2019 | $3,169 | $125,223 | $40,000 | $85,223 |
| 2018 | $1,038 | $106,000 | $40,000 | $66,000 |
| 2017 | $2,773 | $106,000 | $40,000 | $66,000 |
| 2016 | $2,563 | $124,510 | $40,000 | $84,510 |
| 2015 | $1,515 | $115,248 | $40,000 | $75,248 |
| 2014 | $1,515 | $92,261 | $20,000 | $72,261 |
Source: Public Records
Map
Nearby Homes
- 2219 Triway Ln Unit 240
- 2233 Triway Ln Unit 267
- 2252 Shadowdale Dr Unit 362
- 10488 Hammerly Blvd Unit 81
- 2212 Shadowdale Dr Unit 358
- 10466 Hammerly Blvd Unit 70
- 2202 Shadowdale Dr Unit 353
- 10454 Norton Dr
- 2342 Triway Ln Unit 147
- 2603 Durban Dr
- 10415 Westray St
- 10382 Hammerly Blvd
- 2618 Fontana Dr
- 2614 Manila Ln
- 10227 Emnora Ln
- 10525 Moorberry Ln
- 2730 Manila Ln
- 10226 Rothbury St
- 2715 Kenross St
- 2706 Stetson Ln
- 2343 Triway Ln Unit 217
- 2341 Triway Ln Unit 216
- 2339 Triway Ln Unit 215
- 2361 Triway Ln Unit 219
- 2357 Triway Ln Unit 221
- 2359 Triway Ln Unit 220
- 2355 Triway Ln Unit 222
- 2337 Triway Ln Unit 214
- 2353 Triway Ln Unit 223
- 2335 Triway Ln Unit 213
- 10443 Emnora Ln
- 10439 Emnora Ln
- 2333 Triway Ln Unit 212
- 10447 Emnora Ln
- 2349 Triway Ln Unit 225
- 10435 Emnora Ln
- 2347 Triway Ln Unit 226
- 2338 Shadowdale Dr Unit 301
- 10451 Emnora Ln
- 2340 Shadowdale Dr