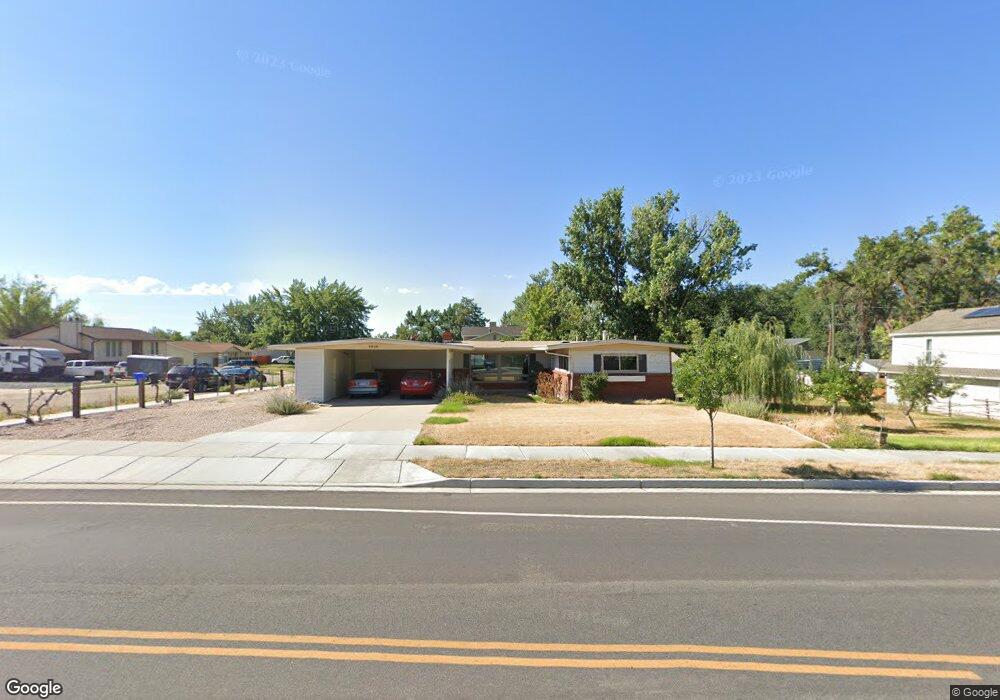
2345 W 800 N Clearfield, UT 84015
Estimated Value: $489,000 - $608,000
4
Beds
3
Baths
2,598
Sq Ft
$204/Sq Ft
Est. Value
About This Home
This home is located at 2345 W 800 N, Clearfield, UT 84015 and is currently estimated at $528,945, approximately $203 per square foot. 2345 W 800 N is a home located in Davis County with nearby schools including Lakeside School, West Point Junior High School, and Syracuse High School.
Ownership History
Date
Name
Owned For
Owner Type
Purchase Details
Closed on
Mar 13, 2023
Sold by
Jensen Christopher A and Jensen Natalie
Bought by
Johns Living Trust
Current Estimated Value
Home Financials for this Owner
Home Financials are based on the most recent Mortgage that was taken out on this home.
Original Mortgage
$445,300
Outstanding Balance
$430,816
Interest Rate
6.13%
Mortgage Type
New Conventional
Estimated Equity
$98,129
Purchase Details
Closed on
Sep 26, 2016
Sold by
Borell Richard R and Borell Jolenem
Bought by
Jensen Christopher A and Jensen Natalie
Purchase Details
Closed on
Sep 23, 2011
Sold by
Brown Jesse G
Bought by
Borell Richard R and Borell Jolene M
Home Financials for this Owner
Home Financials are based on the most recent Mortgage that was taken out on this home.
Original Mortgage
$160,914
Interest Rate
4.5%
Mortgage Type
FHA
Purchase Details
Closed on
Nov 1, 2007
Sold by
Brown Jesse G
Bought by
Brown Jesse G and The Jesse G Brown Revocable Trust
Create a Home Valuation Report for This Property
The Home Valuation Report is an in-depth analysis detailing your home's value as well as a comparison with similar homes in the area
Home Values in the Area
Average Home Value in this Area
Purchase History
| Date | Buyer | Sale Price | Title Company |
|---|---|---|---|
| Johns Living Trust | -- | -- | |
| Jensen Christopher A | -- | Stewart Title | |
| Borell Richard R | -- | Security Title Of Da | |
| Brown Jesse G | -- | None Available |
Source: Public Records
Mortgage History
| Date | Status | Borrower | Loan Amount |
|---|---|---|---|
| Open | Johns Living Trust | $445,300 | |
| Previous Owner | Borell Richard R | $160,914 |
Source: Public Records
Tax History Compared to Growth
Tax History
| Year | Tax Paid | Tax Assessment Tax Assessment Total Assessment is a certain percentage of the fair market value that is determined by local assessors to be the total taxable value of land and additions on the property. | Land | Improvement |
|---|---|---|---|---|
| 2025 | $2,851 | $268,950 | $139,167 | $129,783 |
| 2024 | $2,851 | $268,400 | $125,143 | $143,257 |
| 2023 | $2,628 | $455,000 | $165,227 | $289,773 |
| 2022 | $2,849 | $270,050 | $88,638 | $181,412 |
| 2021 | $2,687 | $381,000 | $128,291 | $252,709 |
| 2020 | $2,366 | $331,000 | $109,581 | $221,419 |
| 2019 | $2,029 | $280,000 | $100,485 | $179,515 |
| 2018 | $1,802 | $245,000 | $96,778 | $148,222 |
| 2016 | $1,463 | $104,665 | $37,606 | $67,059 |
| 2015 | $1,413 | $95,810 | $37,606 | $58,204 |
| 2014 | $1,578 | $108,517 | $37,606 | $70,911 |
| 2013 | -- | $75,838 | $32,692 | $43,146 |
Source: Public Records
Map
Nearby Homes