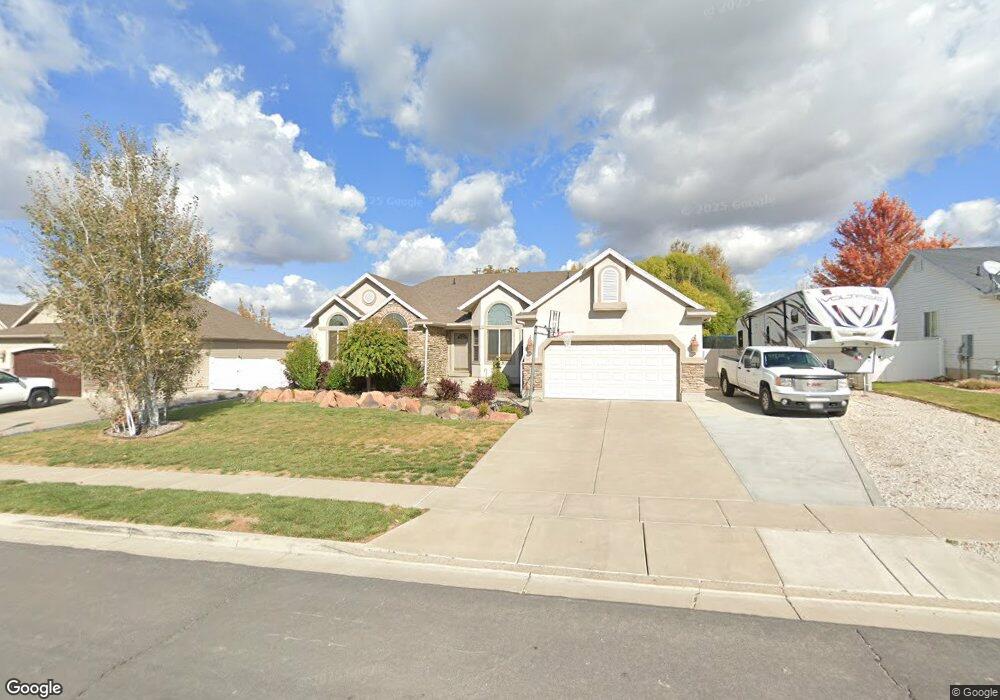
2346 W 2650 N Clearfield, UT 84015
Estimated Value: $613,000 - $681,000
5
Beds
4
Baths
3,912
Sq Ft
$168/Sq Ft
Est. Value
About This Home
This home is located at 2346 W 2650 N, Clearfield, UT 84015 and is currently estimated at $655,608, approximately $167 per square foot. 2346 W 2650 N is a home located in Weber County with nearby schools including West Clinton Elementary School, West Point Junior High School, and Clearfield High School.
Ownership History
Date
Name
Owned For
Owner Type
Purchase Details
Closed on
Dec 10, 2011
Sold by
James John H and James Jennifer M
Bought by
Munn Kylee
Current Estimated Value
Home Financials for this Owner
Home Financials are based on the most recent Mortgage that was taken out on this home.
Original Mortgage
$278,806
Outstanding Balance
$190,486
Interest Rate
4.06%
Mortgage Type
VA
Estimated Equity
$465,122
Purchase Details
Closed on
Aug 15, 2007
Sold by
James John H
Bought by
James John H and James Jennifer M
Home Financials for this Owner
Home Financials are based on the most recent Mortgage that was taken out on this home.
Original Mortgage
$237,300
Interest Rate
6.73%
Mortgage Type
New Conventional
Purchase Details
Closed on
Sep 14, 2005
Sold by
Co Gmw Development Inc
Bought by
James John H and James Jennifer M
Home Financials for this Owner
Home Financials are based on the most recent Mortgage that was taken out on this home.
Original Mortgage
$45,360
Interest Rate
10.62%
Mortgage Type
Stand Alone Second
Create a Home Valuation Report for This Property
The Home Valuation Report is an in-depth analysis detailing your home's value as well as a comparison with similar homes in the area
Home Values in the Area
Average Home Value in this Area
Purchase History
| Date | Buyer | Sale Price | Title Company |
|---|---|---|---|
| Munn Kylee | -- | First American Title | |
| James John H | -- | Accommodation | |
| James John H | -- | First American Title | |
| James John H | -- | Cottonwood Title Ins Agency |
Source: Public Records
Mortgage History
| Date | Status | Borrower | Loan Amount |
|---|---|---|---|
| Open | Munn Kylee | $278,806 | |
| Previous Owner | James John H | $237,300 | |
| Previous Owner | James John H | $45,360 | |
| Previous Owner | James John H | $181,450 |
Source: Public Records
Tax History Compared to Growth
Tax History
| Year | Tax Paid | Tax Assessment Tax Assessment Total Assessment is a certain percentage of the fair market value that is determined by local assessors to be the total taxable value of land and additions on the property. | Land | Improvement |
|---|---|---|---|---|
| 2025 | $3,621 | $348,150 | $106,884 | $241,266 |
| 2024 | $3,647 | $352,550 | $115,653 | $236,897 |
| 2023 | $3,461 | $619,000 | $134,812 | $484,188 |
| 2022 | $3,419 | $338,250 | $78,565 | $259,685 |
| 2021 | $3,059 | $449,000 | $105,006 | $343,994 |
| 2020 | $2,692 | $391,000 | $92,940 | $298,060 |
| 2019 | $2,629 | $373,000 | $101,802 | $271,198 |
| 2018 | $2,489 | $347,000 | $85,131 | $261,869 |
| 2016 | $2,197 | $158,180 | $33,896 | $124,284 |
| 2015 | $2,185 | $149,545 | $33,896 | $115,649 |
| 2014 | $2,026 | $140,864 | $33,896 | $106,968 |
| 2013 | -- | $136,304 | $30,183 | $106,121 |
Source: Public Records
Map
Nearby Homes
- 2592 W 2650 N
- 2241 W 2475 N
- 2657 N 2000 W
- 2593 N 2000 W
- 5856 S 3950 W
- 3780 W 5850 S
- 2322 N 2500 W
- 2434 W 2250 N
- 2318 N 2100 W
- 3826 W 5750 S
- 5762 S 4050 W
- 4164 W 5950 S
- 3923 W 5700 S
- 5778 S 4075 W
- 2162 N 2290 W
- Harvard Plan at Summerfield - Enclave
- 2208 W 2615 N
- Linden Plan at Summerfield - Vista
- Yale Plan at Summerfield - Enclave
- Gambel Oak Plan at Summerfield - Vista