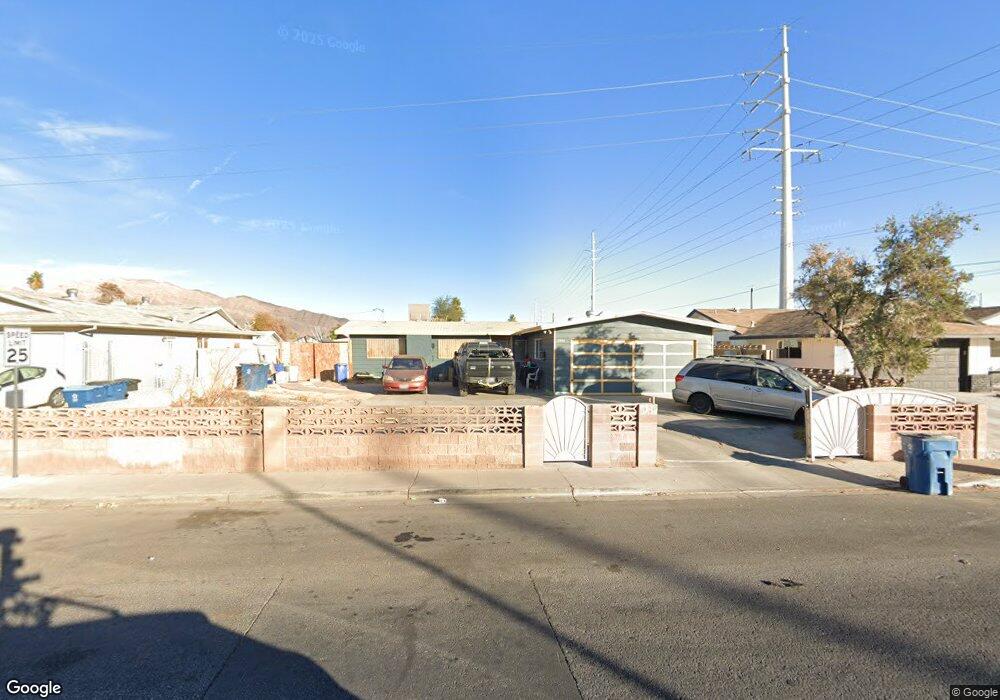
2346 Winterwood Blvd Las Vegas, NV 89142
Estimated Value: $351,508 - $390,000
4
Beds
2
Baths
1,624
Sq Ft
$232/Sq Ft
Est. Value
About This Home
This home is located at 2346 Winterwood Blvd, Las Vegas, NV 89142 and is currently estimated at $376,377, approximately $231 per square foot. 2346 Winterwood Blvd is a home located in Clark County with nearby schools including Cyril Wengert Elementary School, Duane D. Keller Middle School, and Las Vegas High School.
Ownership History
Date
Name
Owned For
Owner Type
Purchase Details
Closed on
Mar 27, 1997
Sold by
Brooks Laura Hatch and Brooks Roger Alan
Bought by
Marin Angel A
Current Estimated Value
Home Financials for this Owner
Home Financials are based on the most recent Mortgage that was taken out on this home.
Original Mortgage
$85,975
Outstanding Balance
$10,864
Interest Rate
7.63%
Estimated Equity
$365,513
Purchase Details
Closed on
Jan 9, 1996
Sold by
Brooks Laura Hatch and Brooks Roger Alan
Bought by
Brooks Roger Alan and Brooks Laura Hatch
Home Financials for this Owner
Home Financials are based on the most recent Mortgage that was taken out on this home.
Original Mortgage
$80,000
Interest Rate
8.75%
Purchase Details
Closed on
Oct 1, 1993
Sold by
Hatch David E and Hatch Patricia
Bought by
Allen Brooks Laura Hatch Roger
Create a Home Valuation Report for This Property
The Home Valuation Report is an in-depth analysis detailing your home's value as well as a comparison with similar homes in the area
Home Values in the Area
Average Home Value in this Area
Purchase History
| Date | Buyer | Sale Price | Title Company |
|---|---|---|---|
| Marin Angel A | $90,500 | Lawyers Title | |
| Marin Angel A | -- | Lawyers Title | |
| Brooks Roger Alan | -- | Fidelity National Title | |
| Allen Brooks Laura Hatch Roger | $95,000 | -- |
Source: Public Records
Mortgage History
| Date | Status | Borrower | Loan Amount |
|---|---|---|---|
| Open | Marin Angel A | $85,975 | |
| Previous Owner | Allen Brooks Laura Hatch Roger | $80,000 |
Source: Public Records
Tax History Compared to Growth
Tax History
| Year | Tax Paid | Tax Assessment Tax Assessment Total Assessment is a certain percentage of the fair market value that is determined by local assessors to be the total taxable value of land and additions on the property. | Land | Improvement |
|---|---|---|---|---|
| 2025 | $710 | $49,523 | $28,700 | $20,823 |
| 2024 | $690 | $49,523 | $28,700 | $20,823 |
| 2023 | $690 | $50,321 | $31,500 | $18,821 |
| 2022 | $670 | $44,850 | $28,000 | $16,850 |
| 2021 | $650 | $40,507 | $24,850 | $15,657 |
| 2020 | $628 | $40,073 | $24,850 | $15,223 |
| 2019 | $610 | $33,944 | $19,250 | $14,694 |
| 2018 | $592 | $33,019 | $19,250 | $13,769 |
| 2017 | $896 | $30,567 | $16,100 | $14,467 |
| 2016 | $562 | $28,162 | $12,600 | $15,562 |
| 2015 | $560 | $25,658 | $9,800 | $15,858 |
| 2014 | $543 | $23,504 | $7,000 | $16,504 |
Source: Public Records
Map
Nearby Homes
- 2450 Tournament St
- 2454 Winterwood Blvd
- 2306 Abarth St
- 2369 Citroen St
- 1919 Niblick Cir
- 2484 Anglia St
- 1950 Abarth St
- 2058 Citroen St
- 2508 Alfa Cir
- 5406 Silverheart Ave
- 5539 Ballinger Dr
- 1871 Cobra Ct
- 1745 Starridge Way
- 2229 Bowstring Dr
- 1721 Starridge Way
- 5330 Walton Heath Ave
- 1841 Skywood Way
- 1728 S Christy Ln
- 1718 S Christy Ln
- 5083 Village Dr
- 2324 Winterwood Blvd
- 2329 Anglia St
- 2302 Winterwood Blvd
- 2307 Anglia St Unit 2
- 5363 Consul Ave
- 5425 Consul Ave
- 2280 Winterwood Blvd
- 2285 Anglia St
- 2422 Winterwood Blvd
- 5351 Consul Ave
- 2263 Anglia St
- 2258 Winterwood Blvd
- 5435 Consul Ave
- 5424 Bentley Ave
- 5432 Consul Ave
- 2434 Winterwood Blvd
- 2434 Winterwood Blvd Unit none
- 5341 Consul Ave
- 2427 Winterwood Blvd