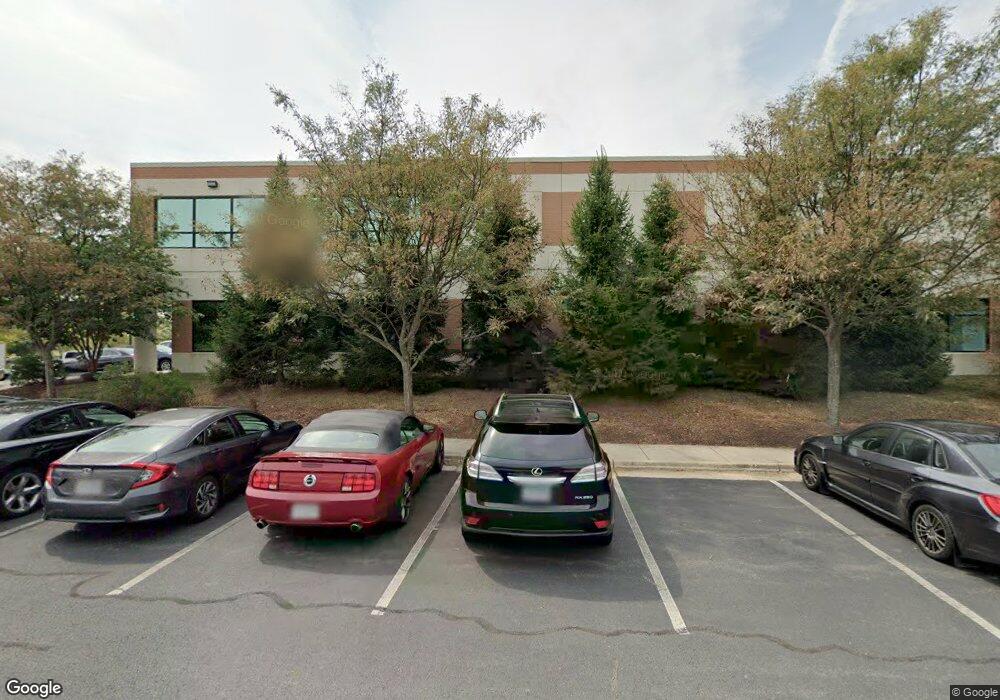
23465 Rock Haven Way Unit 150-155 Sterling, VA 20166
Estimated Value: $2,216,175
--
Bed
--
Bath
8,401
Sq Ft
$264/Sq Ft
Est. Value
About This Home
This home is located at 23465 Rock Haven Way Unit 150-155, Sterling, VA 20166 and is currently estimated at $2,216,175, approximately $263 per square foot. 23465 Rock Haven Way Unit 150-155 is a home located in Loudoun County with nearby schools including Rosa Lee Carter Elementary School, Rock Ridge High School, and Stone Hill Middle School.
Ownership History
Date
Name
Owned For
Owner Type
Purchase Details
Closed on
Jan 26, 2018
Sold by
Dtdk Llc A Virginia Limited Liability Co
Bought by
Topend Properties Llc A Virginia Limited
Current Estimated Value
Home Financials for this Owner
Home Financials are based on the most recent Mortgage that was taken out on this home.
Original Mortgage
$991,500
Outstanding Balance
$838,442
Interest Rate
3.93%
Mortgage Type
Commercial
Estimated Equity
$1,377,733
Purchase Details
Closed on
Feb 29, 2012
Sold by
Virginia Luminor Real Estate
Bought by
Dtdk Llc
Purchase Details
Closed on
Jul 30, 2007
Sold by
Dulles Trade Center I D L
Bought by
Virginia Luminor Real Estate
Home Financials for this Owner
Home Financials are based on the most recent Mortgage that was taken out on this home.
Original Mortgage
$1,445,000
Interest Rate
6.78%
Mortgage Type
Construction
Create a Home Valuation Report for This Property
The Home Valuation Report is an in-depth analysis detailing your home's value as well as a comparison with similar homes in the area
Home Values in the Area
Average Home Value in this Area
Purchase History
| Date | Buyer | Sale Price | Title Company |
|---|---|---|---|
| Topend Properties Llc A Virginia Limited | $1,400,000 | Old American Title&Escr Llc | |
| Dtdk Llc | $1,109,600 | -- | |
| Virginia Luminor Real Estate | $1,279,890 | -- |
Source: Public Records
Mortgage History
| Date | Status | Borrower | Loan Amount |
|---|---|---|---|
| Open | Topend Properties Llc A Virginia Limited | $991,500 | |
| Previous Owner | Virginia Luminor Real Estate | $1,445,000 |
Source: Public Records
Tax History Compared to Growth
Tax History
| Year | Tax Paid | Tax Assessment Tax Assessment Total Assessment is a certain percentage of the fair market value that is determined by local assessors to be the total taxable value of land and additions on the property. | Land | Improvement |
|---|---|---|---|---|
| 2025 | $18,044 | $1,795,430 | $210,000 | $1,585,430 |
| 2024 | $18,674 | $1,753,420 | $210,000 | $1,543,420 |
| 2023 | $14,240 | $1,627,410 | $210,000 | $1,417,410 |
| 2022 | $14,110 | $1,585,400 | $210,000 | $1,375,400 |
| 2021 | $11,420 | $1,165,350 | $210,000 | $955,350 |
| 2020 | $12,061 | $1,165,350 | $210,000 | $955,350 |
| 2019 | $11,388 | $1,089,740 | $210,000 | $879,740 |
| 2018 | $11,550 | $1,064,540 | $210,000 | $854,540 |
| 2017 | $11,976 | $1,064,540 | $210,000 | $854,540 |
| 2016 | $11,156 | $974,280 | $0 | $0 |
| 2015 | $11,058 | $764,280 | $0 | $764,280 |
| 2014 | $11,253 | $764,280 | $0 | $764,280 |
Source: Public Records
Map
Nearby Homes
- 43186 Mongold Square
- 43179 Mongold Square
- 23158 Glenorchy Ct
- 23647 Hopewell Manor Terrace
- 23646 Hopewell Manor Terrace
- 23475 Belvoir Woods Terrace
- 23465 Belvoir Woods Terrace
- 43011 Clarks Mill Terrace
- 23579 Belvoir Woods Terrace
- 43089 Greeley Square
- 23516 Hopewell Manor Terrace
- 43053 Thoroughfare Gap Terrace
- 43180 Loudoun Reserve Dr
- 42920 Firefly Sonata Terrace Unit 307
- 23069 Weybridge Square
- 23297 Southdown Manor Terrace Unit 105
- 23271 Southdown Manor Terrace Unit 108
- 43221 Greeley Square
- Aurora Plan at Birchwood at Brambleton - Birchwood Courtyard Homes
- 43044 Greeley Square
- 23465 Rock Haven Way Unit 135
- 23465 Rock Haven Way Unit 115
- 23465 Rock Haven Way Unit 145 150
- 23465 Rock Haven Way Unit 100
- 23465 Rock Haven Way Unit 120
- 23465 Rock Haven Way Unit 125
- 23465 Rock Haven Way Unit 105
- 23465 Rock Haven Way Unit 200
- 23465 Rock Haven Way Unit 150
- 23465 Rock Haven Way Unit 130
- 23465 Rock Haven Way Unit 110
- 23465 Rock Haven Way Unit 230
- 23475 Rock Haven Way Unit 100
- 23475 Rock Haven Way Unit 140
- 23475 Rock Haven Way Unit 110
- 23475 Rock Haven Way Unit 150
- 23475 Rock Haven Way Unit 125
- 23475 Rock Haven Way Unit 255
- 23475 Rock Haven Way Unit 130
- 23475 Rock Haven Way Unit 135