Estimated Value: $506,439 - $552,000
3
Beds
2
Baths
2,430
Sq Ft
$219/Sq Ft
Est. Value
About This Home
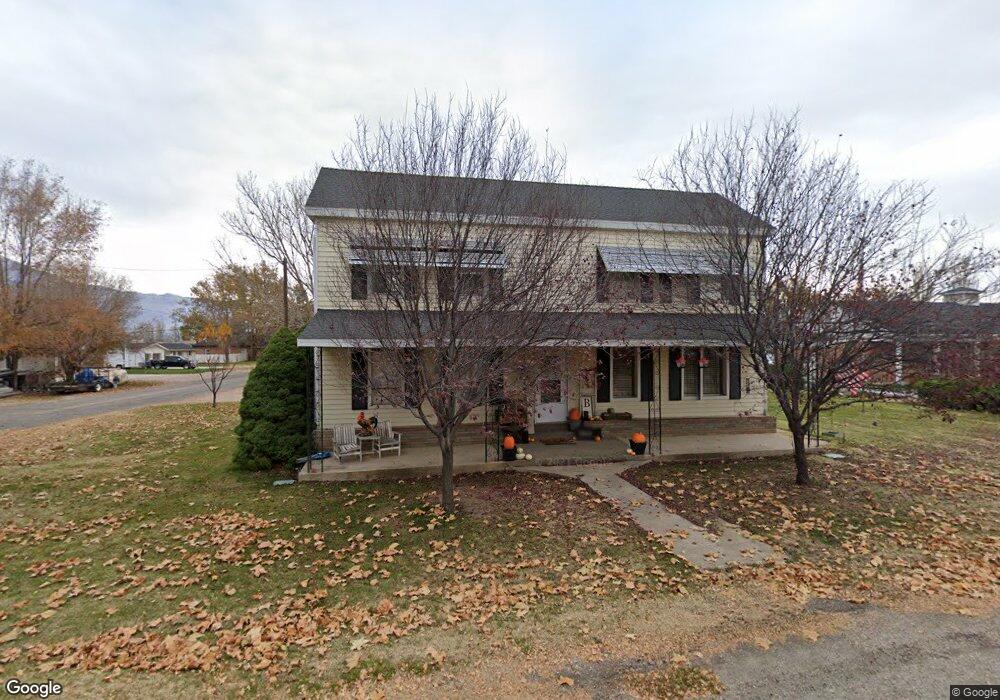
This home is located at 2348 N 4350 W, Ogden, UT 84404 and is currently estimated at $532,110, approximately $218 per square foot. 2348 N 4350 W is a home located in Weber County with nearby schools including Plain City School, Wahlquist Junior High School, and Fremont High School.
Ownership History
Date
Name
Owned For
Owner Type
Purchase Details
Closed on
Mar 22, 2024
Sold by
Beesley Jon D and Beesley Shelly A
Bought by
Beesley Jon D and Beesley Shelly A
Current Estimated Value
Home Financials for this Owner
Home Financials are based on the most recent Mortgage that was taken out on this home.
Original Mortgage
$140,000
Outstanding Balance
$137,732
Interest Rate
6.77%
Mortgage Type
New Conventional
Estimated Equity
$394,378
Purchase Details
Closed on
Sep 6, 2014
Sold by
Moyes Craig P
Bought by
Moyes Lynn and Moyes Kay H
Purchase Details
Closed on
Apr 10, 2003
Sold by
Beesley Family Trust
Bought by
Beesley Jon D and Beesley Shelly A
Purchase Details
Closed on
Dec 2, 2002
Sold by
Wismer Dian and Beesley Carol Jean
Bought by
Beesley Carol Jean C
Home Financials for this Owner
Home Financials are based on the most recent Mortgage that was taken out on this home.
Original Mortgage
$72,000
Interest Rate
6.28%
Mortgage Type
Purchase Money Mortgage
Create a Home Valuation Report for This Property
The Home Valuation Report is an in-depth analysis detailing your home's value as well as a comparison with similar homes in the area
Home Values in the Area
Average Home Value in this Area
Purchase History
| Date | Buyer | Sale Price | Title Company |
|---|---|---|---|
| Beesley Jon D | -- | Title Guarantee | |
| Moyes Lynn | -- | None Available | |
| Beesley Jon D | -- | None Listed On Document | |
| Beesley Jon D | -- | None Listed On Document | |
| Beesley Carol Jean C | -- | Us Title |
Source: Public Records
Mortgage History
| Date | Status | Borrower | Loan Amount |
|---|---|---|---|
| Open | Beesley Jon D | $140,000 | |
| Previous Owner | Beesley Carol Jean C | $72,000 |
Source: Public Records
Tax History Compared to Growth
Tax History
| Year | Tax Paid | Tax Assessment Tax Assessment Total Assessment is a certain percentage of the fair market value that is determined by local assessors to be the total taxable value of land and additions on the property. | Land | Improvement |
|---|---|---|---|---|
| 2025 | $2,441 | $434,723 | $153,389 | $281,334 |
| 2024 | $2,353 | $235,397 | $84,439 | $150,958 |
| 2023 | $2,148 | $212,850 | $76,259 | $136,591 |
| 2022 | $2,290 | $235,950 | $73,544 | $162,406 |
| 2021 | $2,121 | $368,000 | $64,155 | $303,845 |
| 2020 | $1,884 | $297,001 | $54,163 | $242,838 |
| 2019 | $1,809 | $268,000 | $49,300 | $218,700 |
| 2018 | $1,732 | $244,000 | $49,300 | $194,700 |
| 2017 | $1,493 | $195,000 | $43,467 | $151,533 |
| 2016 | $1,333 | $93,473 | $21,784 | $71,689 |
| 2015 | $1,420 | $99,073 | $21,784 | $77,289 |
| 2014 | $1,324 | $89,630 | $22,422 | $67,208 |
Source: Public Records
Map
Nearby Homes
- 2416 N 4275 W
- 4210 W 1975 N
- 2131 N 4650 W
- 3966 W 2200 N
- 1885 N 4475 W
- 2700 N 4200 W
- 3622 W 2200 St N Unit 23
- 2793 W 2775 N
- 2797 W 2775 N Unit 129
- 2782 W 2775 N Unit 105
- 2792 W 2775 N Unit 103
- 2787 W 2775 N Unit 127
- 4227 W Pioneer Rd
- 1748 N 4100 St W
- 3963 2800 North St
- 4188 W 2875 N
- 4212 W 1975 N
- 2255 N 3600 St W Unit 21
- 2233 N 3600 St W Unit 22
- 3594 W 2200 N Unit 3