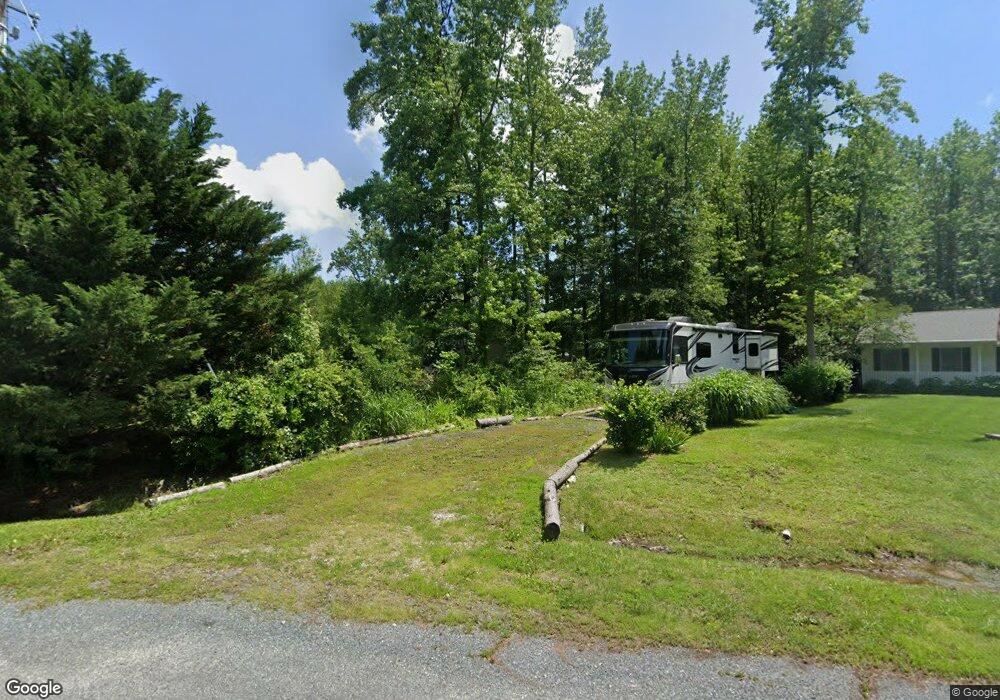
23485 Clarissa Rd Chestertown, MD 21620
Estimated Value: $287,000 - $327,000
3
Beds
2
Baths
1,248
Sq Ft
$247/Sq Ft
Est. Value
About This Home
This home is located at 23485 Clarissa Rd, Chestertown, MD 21620 and is currently estimated at $308,805, approximately $247 per square foot. 23485 Clarissa Rd is a home located in Kent County with nearby schools including Center for Innovation, Kent County Middle School, and Kent County High School.
Ownership History
Date
Name
Owned For
Owner Type
Purchase Details
Closed on
Apr 12, 2011
Sold by
Legg Janet B
Bought by
Flynn Arthur H and Flynn Denise A
Current Estimated Value
Home Financials for this Owner
Home Financials are based on the most recent Mortgage that was taken out on this home.
Original Mortgage
$84,155
Outstanding Balance
$55,129
Interest Rate
3.75%
Mortgage Type
Adjustable Rate Mortgage/ARM
Estimated Equity
$253,676
Purchase Details
Closed on
Mar 13, 2002
Sold by
Kimble Janet B
Bought by
Legg Janet B
Purchase Details
Closed on
Mar 13, 2000
Sold by
Stoltzfus John M
Bought by
Kimble Janet B
Purchase Details
Closed on
Oct 31, 1997
Sold by
K & J Builders
Bought by
Stoltzfus John M
Create a Home Valuation Report for This Property
The Home Valuation Report is an in-depth analysis detailing your home's value as well as a comparison with similar homes in the area
Home Values in the Area
Average Home Value in this Area
Purchase History
| Date | Buyer | Sale Price | Title Company |
|---|---|---|---|
| Flynn Arthur H | $160,000 | -- | |
| Legg Janet B | -- | -- | |
| Kimble Janet B | $99,900 | -- | |
| Stoltzfus John M | -- | -- |
Source: Public Records
Mortgage History
| Date | Status | Borrower | Loan Amount |
|---|---|---|---|
| Open | Flynn Arthur H | $84,155 |
Source: Public Records
Tax History Compared to Growth
Tax History
| Year | Tax Paid | Tax Assessment Tax Assessment Total Assessment is a certain percentage of the fair market value that is determined by local assessors to be the total taxable value of land and additions on the property. | Land | Improvement |
|---|---|---|---|---|
| 2025 | $2,161 | $213,300 | $60,700 | $152,600 |
| 2024 | $2,051 | $194,767 | $0 | $0 |
| 2023 | $1,947 | $176,233 | $0 | $0 |
| 2022 | $1,833 | $157,700 | $60,700 | $97,000 |
| 2021 | $1,848 | $157,700 | $60,700 | $97,000 |
| 2020 | $1,848 | $157,700 | $60,700 | $97,000 |
| 2019 | $1,877 | $160,200 | $65,200 | $95,000 |
| 2018 | $1,877 | $160,200 | $65,200 | $95,000 |
| 2017 | $1,877 | $160,200 | $0 | $0 |
| 2016 | -- | $161,300 | $0 | $0 |
| 2015 | $2,033 | $161,300 | $0 | $0 |
| 2014 | $2,033 | $161,300 | $0 | $0 |
Source: Public Records
Map
Nearby Homes
- 0 Lenapah Rd
- 0 Tonopah Rd Unit MDKE2005470
- 0 Tonopah Rd Unit MDKE2005564
- Parcel Buck Neck Ldg Rd
- 10751 Millbrook Dr
- 0 Towhee Rd
- 0 Cogar Rd Unit MDKE2005472
- 0 Kinglet Rd
- 0 Cloquet Rd Unit MDKE2005966
- 0 Lot 24 & 25 Buck Neck Rd Unit MDKE2004828
- 0 Spinnaker Rd
- LOTS 253-254 Carimon Rd
- 0 Bunting Rd
- 0 Redfield Rd Unit MDKE2002842
- 0 Beltram Rd
- 0 Sandpiper Rd Unit MDKE2005542
- 0 Buck Neck Rd Unit MDKE2005262
- 0 Clarissa Rd Unit MDKE2005786
- 23710 L Rd
- 0 Sheldrake Dr
- 10620 Colfax Rd
- 10612 Colfax Rd
- 23480 Clarissa Rd
- 23480 Rhea Ct
- 23453 Clarissa Rd
- 10600 Hyala Ct
- Lot Hyala Ct
- 23491 Rhea Ct
- 0 Clarissa Road Parcel 161
- 10592 Colfax Rd
- 10615 Colfax Rd
- 23460 Clarissa Rd
- 23441 Clarissa Rd
- 23485 Rhea Ct
- 23482 Lenopah Rd
- 10610 Klamath Rd
- 0 Hyala Rd S Unit 1002907118
- 10589 Colfax Rd
- 0 Colfax Rd
- 23492 Lenopah Rd