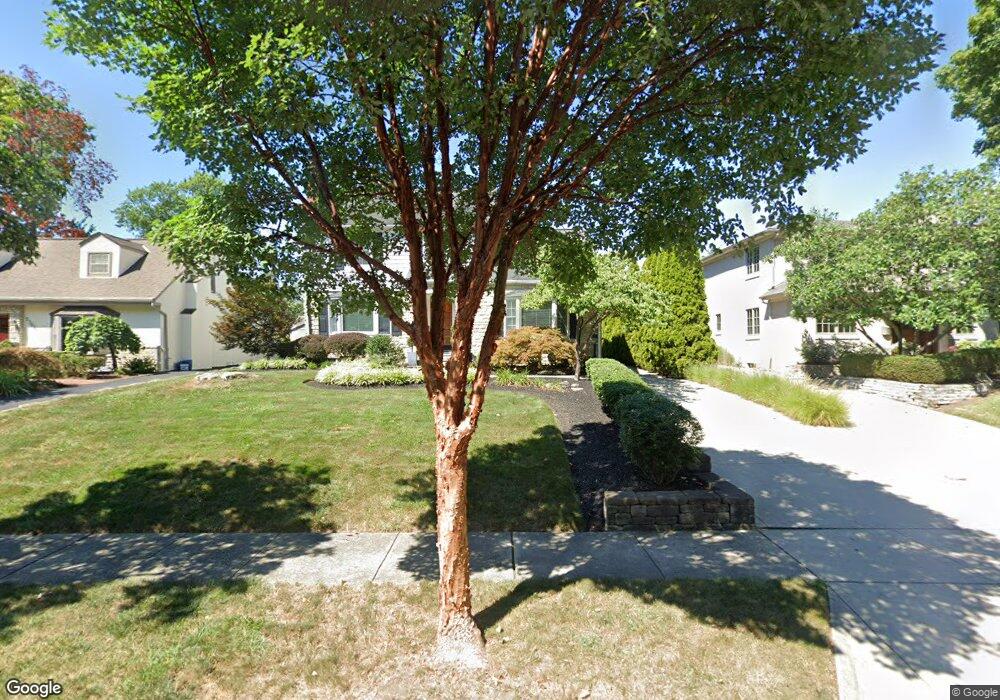
2349 Brandon Rd Columbus, OH 43221
Estimated Value: $756,000 - $870,000
3
Beds
3
Baths
1,994
Sq Ft
$406/Sq Ft
Est. Value
About This Home
This home is located at 2349 Brandon Rd, Columbus, OH 43221 and is currently estimated at $808,734, approximately $405 per square foot. 2349 Brandon Rd is a home located in Franklin County with nearby schools including Barrington Road Elementary School, Jones Middle School, and Upper Arlington High School.
Ownership History
Date
Name
Owned For
Owner Type
Purchase Details
Closed on
Feb 7, 2025
Sold by
Mahan Joseph P
Bought by
Firing Martha
Current Estimated Value
Purchase Details
Closed on
Jun 18, 2021
Sold by
Johnson David C and Johnson Christy A
Bought by
Mahan Joseph P
Purchase Details
Closed on
Mar 21, 2003
Sold by
Kentris Susan J and Kentris George L
Bought by
Johnson David C and Smith Christy A
Home Financials for this Owner
Home Financials are based on the most recent Mortgage that was taken out on this home.
Original Mortgage
$240,000
Interest Rate
5.71%
Purchase Details
Closed on
Jun 26, 1998
Sold by
Obrien Robert M and Obrien Brenda F
Bought by
Kentris Susan J
Purchase Details
Closed on
Sep 23, 1993
Purchase Details
Closed on
Feb 1, 1985
Create a Home Valuation Report for This Property
The Home Valuation Report is an in-depth analysis detailing your home's value as well as a comparison with similar homes in the area
Home Values in the Area
Average Home Value in this Area
Purchase History
| Date | Buyer | Sale Price | Title Company |
|---|---|---|---|
| Firing Martha | -- | None Listed On Document | |
| Mahan Joseph P | $670,000 | Crown Search Services Ltd | |
| Johnson David C | $300,000 | -- | |
| Kentris Susan J | $234,500 | Franklin Abstract | |
| -- | $165,000 | -- | |
| -- | $86,000 | -- |
Source: Public Records
Mortgage History
| Date | Status | Borrower | Loan Amount |
|---|---|---|---|
| Previous Owner | Johnson David C | $240,000 |
Source: Public Records
Tax History Compared to Growth
Tax History
| Year | Tax Paid | Tax Assessment Tax Assessment Total Assessment is a certain percentage of the fair market value that is determined by local assessors to be the total taxable value of land and additions on the property. | Land | Improvement |
|---|---|---|---|---|
| 2024 | $12,152 | $203,390 | $69,090 | $134,300 |
| 2023 | $12,196 | $203,390 | $69,090 | $134,300 |
| 2022 | $12,257 | $169,960 | $44,100 | $125,860 |
| 2021 | $10,752 | $169,960 | $44,100 | $125,860 |
| 2020 | $10,420 | $169,960 | $44,100 | $125,860 |
| 2019 | $9,718 | $140,140 | $44,100 | $96,040 |
| 2018 | $4,831 | $140,140 | $44,100 | $96,040 |
| 2017 | $9,643 | $140,140 | $44,100 | $96,040 |
| 2016 | $8,186 | $123,800 | $35,630 | $88,170 |
| 2015 | $4,089 | $123,800 | $35,630 | $88,170 |
| 2014 | $8,188 | $123,800 | $35,630 | $88,170 |
| 2013 | $3,909 | $112,525 | $32,375 | $80,150 |
Source: Public Records
Map
Nearby Homes
- 2276 Northwest Blvd
- 1565 Berkshire Rd
- 1932 Suffolk Rd Unit 1932
- 2569 Chester Rd
- 2585 Westmont Blvd
- 1535 Doone Rd
- 2110 Northwest Blvd
- 2615 Northwest Blvd
- 1470 Cardiff Rd
- 2648 Chester Rd
- 1550 College Hill Dr
- 2063 Westover Rd
- 1481 Doone Rd
- 1488 Essex Rd
- 2593 Coventry Rd
- 1934 Bedford Rd
- 2295 Oxford Rd
- 1659 Tremont Rd
- 1398 Lower Green Cir Unit 1398
- 1395 Upper Green Cir Unit 1395
- 2341 Brandon Rd
- 2357 Brandon Rd
- 2333 Brandon Rd
- 1781 Berkshire Rd
- 2358 Northwest Blvd
- 2344 Northwest Blvd
- 2372 Northwest Blvd
- 2334 Northwest Blvd
- 2346 Brandon Rd
- 2323 Brandon Rd
- 2358 Brandon Rd
- 2380 Northwest Blvd
- 2326 Brandon Rd
- 2324 Northwest Blvd
- 1755 Berkshire Rd
- 2315 Brandon Rd
- 2318 Brandon Rd
- 2310 Northwest Blvd
- 0 Brandon Rd
- 2310 Brandon Rd