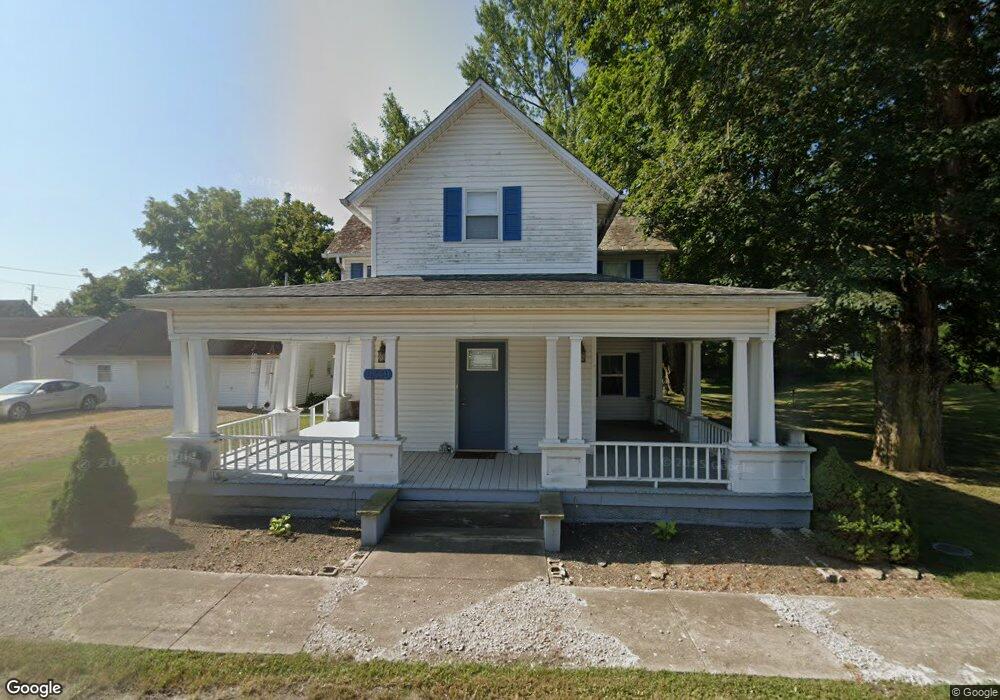
2349 Main St Thurston, OH 43157
Estimated Value: $241,000 - $303,000
3
Beds
2
Baths
1,364
Sq Ft
$195/Sq Ft
Est. Value
About This Home
This home is located at 2349 Main St, Thurston, OH 43157 and is currently estimated at $265,410, approximately $194 per square foot. 2349 Main St is a home with nearby schools including Liberty Union Elementary School, Liberty Union Middle School, and Liberty Union High School.
Ownership History
Date
Name
Owned For
Owner Type
Purchase Details
Closed on
Aug 5, 2019
Sold by
Mauger Wayne E and Mauger Lorri
Bought by
Pape Rusty D
Current Estimated Value
Home Financials for this Owner
Home Financials are based on the most recent Mortgage that was taken out on this home.
Original Mortgage
$190,361
Outstanding Balance
$166,824
Interest Rate
3.73%
Mortgage Type
VA
Estimated Equity
$98,586
Purchase Details
Closed on
May 11, 2018
Sold by
Secretary Of Veterans Affairs
Bought by
Mauger Wayne E and Mauger Lorri
Purchase Details
Closed on
Mar 15, 2018
Sold by
Ditech Financial Llc
Bought by
Secretary Of Veterans Affairs
Purchase Details
Closed on
Oct 25, 2017
Sold by
Shirley William P
Bought by
Ditech Financial Llc
Purchase Details
Closed on
Mar 27, 2001
Sold by
Landis Tamara S
Bought by
Shirley William P and Shirley Donna L
Purchase Details
Closed on
Oct 8, 1991
Sold by
Knapp Charles P
Bought by
Landis Tammy
Create a Home Valuation Report for This Property
The Home Valuation Report is an in-depth analysis detailing your home's value as well as a comparison with similar homes in the area
Home Values in the Area
Average Home Value in this Area
Purchase History
| Date | Buyer | Sale Price | Title Company |
|---|---|---|---|
| Pape Rusty D | $185,900 | None Available | |
| Mauger Wayne E | -- | None Available | |
| Secretary Of Veterans Affairs | -- | None Available | |
| Ditech Financial Llc | $78,000 | None Available | |
| Shirley William P | $126,900 | -- | |
| Landis Tammy | $600 | -- |
Source: Public Records
Mortgage History
| Date | Status | Borrower | Loan Amount |
|---|---|---|---|
| Open | Pape Rusty D | $190,361 | |
| Closed | Shirley William P | -- |
Source: Public Records
Tax History Compared to Growth
Tax History
| Year | Tax Paid | Tax Assessment Tax Assessment Total Assessment is a certain percentage of the fair market value that is determined by local assessors to be the total taxable value of land and additions on the property. | Land | Improvement |
|---|---|---|---|---|
| 2024 | $4,303 | $63,840 | $12,910 | $50,930 |
| 2023 | $2,346 | $63,840 | $12,910 | $50,930 |
| 2022 | $2,329 | $63,840 | $12,910 | $50,930 |
| 2021 | $1,860 | $46,410 | $10,900 | $35,510 |
| 2020 | $1,872 | $46,410 | $10,900 | $35,510 |
| 2019 | $1,874 | $43,860 | $10,900 | $32,960 |
| 2018 | $1,623 | $37,430 | $9,810 | $27,620 |
| 2017 | $1,724 | $36,960 | $9,340 | $27,620 |
| 2016 | $1,663 | $36,960 | $9,340 | $27,620 |
| 2015 | $1,497 | $32,690 | $6,220 | $26,470 |
| 2014 | $1,438 | $32,690 | $6,220 | $26,470 |
| 2013 | $1,438 | $32,690 | $6,220 | $26,470 |
Source: Public Records
Map
Nearby Homes
- 7947 Cherry St
- 2500 Main St
- 8140 Elm St Unit Lot 18
- 0 Baltimore Somerset Rd NE
- 8011 Ruffner Rd NE
- 6781 Thoreau Ln NE
- 0 Lancaster-Newark Rd NE Unit Lot A
- 0 Lancaster-Newark Rd NE
- 570 Baltimore Somerset Rd NE Unit Lot 1
- 2865 Leitnaker Rd NE
- 301 N Main St
- 111 W Columbus St
- 0 Lake Rd NE
- 10159 Lake Rd NE
- 9915 Lancaster-Newark Rd NE
- 5 Baltimore Somerset Rd NW
- 224 Baltimore Somerset Rd NE
- 602 E Cliff St
- 220 N Wagner Ave
- 5505 Tschopp Rd NE