Estimated Value: $389,000 - $609,466
4
Beds
2
Baths
1,240
Sq Ft
$393/Sq Ft
Est. Value
About This Home
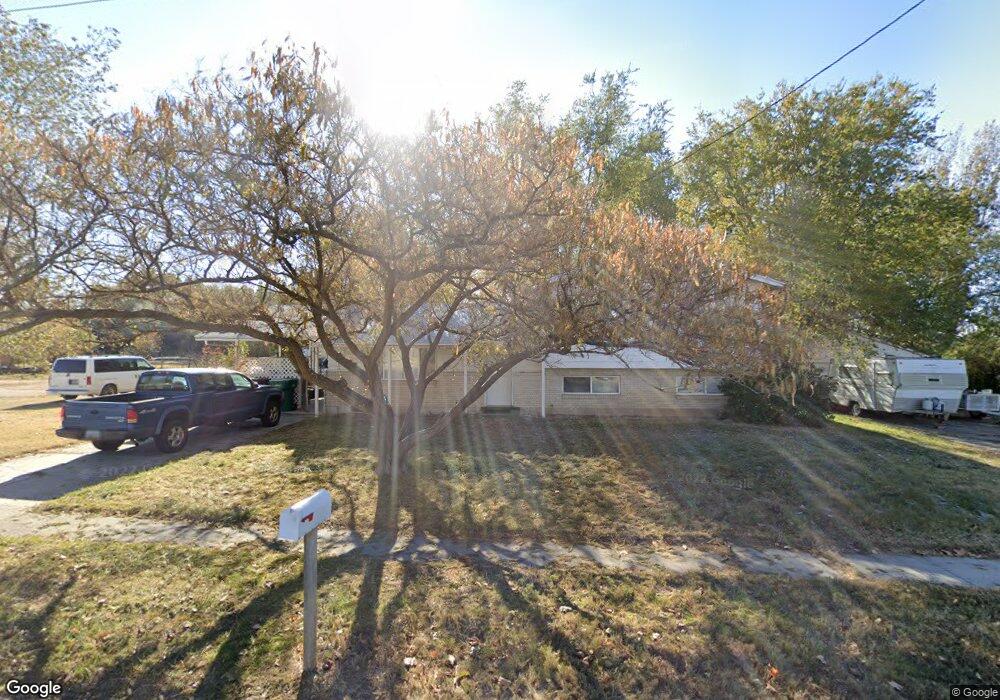
This home is located at 2349 W 6000 S, Roy, UT 84067 and is currently estimated at $486,867, approximately $392 per square foot. 2349 W 6000 S is a home located in Weber County with nearby schools including Municipal School, Roy Junior High School, and Roy High School.
Ownership History
Date
Name
Owned For
Owner Type
Purchase Details
Closed on
Sep 29, 2025
Sold by
Gahan Maria and Bexell Linda R
Bought by
Cw The Caroline Llc
Current Estimated Value
Home Financials for this Owner
Home Financials are based on the most recent Mortgage that was taken out on this home.
Original Mortgage
$6,250,000
Outstanding Balance
$6,250,000
Interest Rate
6.58%
Mortgage Type
Construction
Estimated Equity
-$5,763,133
Purchase Details
Closed on
Jun 27, 2003
Sold by
Bexell Linda R
Bought by
Bexell Ronald D and Bexell Linda R
Home Financials for this Owner
Home Financials are based on the most recent Mortgage that was taken out on this home.
Original Mortgage
$110,000
Interest Rate
5.37%
Mortgage Type
Purchase Money Mortgage
Purchase Details
Closed on
Feb 28, 2002
Sold by
Bexell Linda R
Bought by
Bexell Ronald D and Bexell Linda R
Home Financials for this Owner
Home Financials are based on the most recent Mortgage that was taken out on this home.
Original Mortgage
$108,500
Interest Rate
6.8%
Purchase Details
Closed on
Oct 31, 1996
Sold by
Nelson Fern P and Nelson Fern Patterson
Bought by
Williams Keith G and Williams Charlotte B
Home Financials for this Owner
Home Financials are based on the most recent Mortgage that was taken out on this home.
Original Mortgage
$123,400
Interest Rate
8.11%
Create a Home Valuation Report for This Property
The Home Valuation Report is an in-depth analysis detailing your home's value as well as a comparison with similar homes in the area
Home Values in the Area
Average Home Value in this Area
Purchase History
| Date | Buyer | Sale Price | Title Company |
|---|---|---|---|
| Cw The Caroline Llc | -- | Cottonwood Title | |
| Bexell Ronald D | -- | First American Title | |
| Bexell Linda R | -- | First American Title | |
| Bexell Ronald D | -- | First American Title | |
| Bexell Linda R | -- | First American Title Insuran | |
| Williams Keith G | -- | Bonneville Title |
Source: Public Records
Mortgage History
| Date | Status | Borrower | Loan Amount |
|---|---|---|---|
| Open | Cw The Caroline Llc | $6,250,000 | |
| Previous Owner | Bexell Linda R | $110,000 | |
| Previous Owner | Bexell Linda R | $108,500 | |
| Previous Owner | Williams Keith G | $123,400 |
Source: Public Records
Tax History Compared to Growth
Tax History
| Year | Tax Paid | Tax Assessment Tax Assessment Total Assessment is a certain percentage of the fair market value that is determined by local assessors to be the total taxable value of land and additions on the property. | Land | Improvement |
|---|---|---|---|---|
| 2025 | $3,848 | $570,665 | $243,335 | $327,330 |
| 2024 | $3,789 | $345,003 | $167,550 | $177,453 |
| 2023 | $3,217 | $290,409 | $121,498 | $168,911 |
| 2022 | $3,207 | $277,750 | $87,622 | $190,128 |
| 2021 | $2,483 | $350,000 | $119,241 | $230,759 |
| 2020 | $2,391 | $307,000 | $119,241 | $187,759 |
| 2019 | $2,437 | $295,000 | $88,447 | $206,553 |
| 2018 | $2,308 | $260,000 | $86,576 | $173,424 |
| 2017 | $2,030 | $208,000 | $78,212 | $129,788 |
| 2016 | $1,856 | $114,564 | $55,124 | $59,440 |
| 2015 | $1,804 | $114,564 | $55,124 | $59,440 |
| 2014 | $1,821 | $114,564 | $55,124 | $59,440 |
Source: Public Records
Map
Nearby Homes