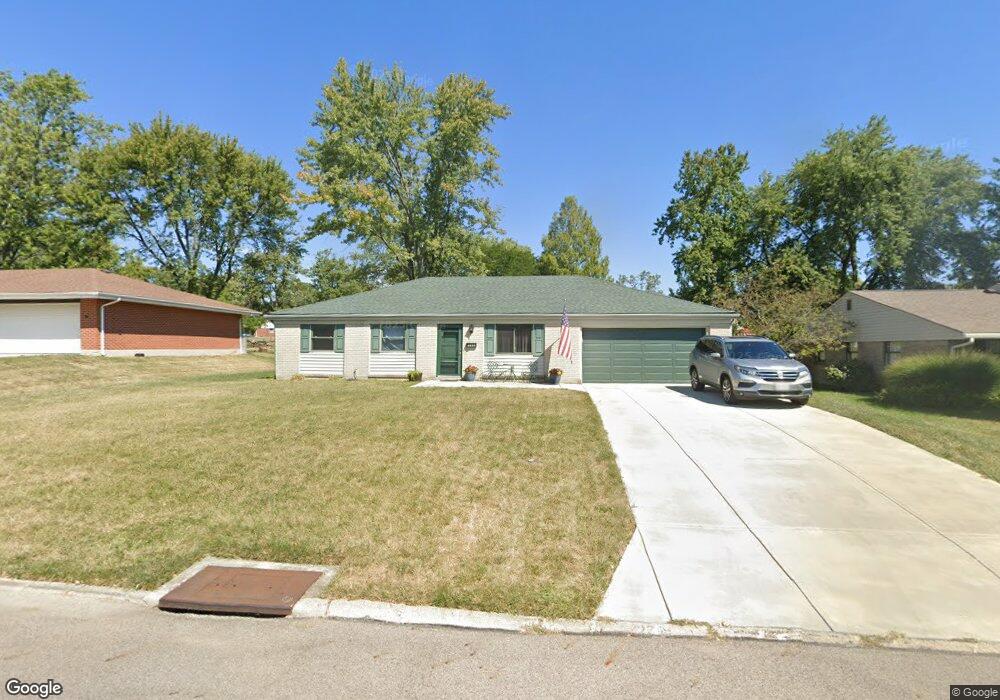
2349 Wymore Place Dayton, OH 45459
Woodbourne-Hyde Park NeighborhoodEstimated Value: $263,683 - $268,000
3
Beds
2
Baths
1,482
Sq Ft
$179/Sq Ft
Est. Value
About This Home
This home is located at 2349 Wymore Place, Dayton, OH 45459 and is currently estimated at $265,171, approximately $178 per square foot. 2349 Wymore Place is a home located in Montgomery County with nearby schools including Miamisburg High School, Bishop Leibold School, and The Miami Valley School.
Ownership History
Date
Name
Owned For
Owner Type
Purchase Details
Closed on
Feb 23, 2015
Sold by
Serotkin Michael E and Serotkin Helen M
Bought by
Serotkin Michael E and Serotkin Helen M
Current Estimated Value
Purchase Details
Closed on
Aug 17, 2002
Sold by
Serotkin Kenneth A
Bought by
Serotkin Michael E
Purchase Details
Closed on
Feb 13, 2002
Sold by
Irvin Lori D
Bought by
Serotkin Michael E and Serotkin Kenneth A
Home Financials for this Owner
Home Financials are based on the most recent Mortgage that was taken out on this home.
Original Mortgage
$77,000
Outstanding Balance
$32,221
Interest Rate
7.23%
Estimated Equity
$232,950
Purchase Details
Closed on
Aug 31, 2001
Sold by
Schmidt Robert J and Schmidt Nancy
Bought by
Irvin Lori D
Home Financials for this Owner
Home Financials are based on the most recent Mortgage that was taken out on this home.
Original Mortgage
$119,059
Interest Rate
7.03%
Mortgage Type
FHA
Purchase Details
Closed on
May 30, 1998
Sold by
Schmidt Linda S
Bought by
Schmidt Robert J
Create a Home Valuation Report for This Property
The Home Valuation Report is an in-depth analysis detailing your home's value as well as a comparison with similar homes in the area
Home Values in the Area
Average Home Value in this Area
Purchase History
| Date | Buyer | Sale Price | Title Company |
|---|---|---|---|
| Serotkin Michael E | -- | Home Site Title | |
| Serotkin Michael E | $30,000 | -- | |
| Serotkin Michael E | $122,000 | -- | |
| Irvin Lori D | $120,000 | -- | |
| Schmidt Robert J | -- | -- | |
| Schmidt Robert J | -- | -- |
Source: Public Records
Mortgage History
| Date | Status | Borrower | Loan Amount |
|---|---|---|---|
| Open | Serotkin Michael E | $77,000 | |
| Previous Owner | Irvin Lori D | $119,059 |
Source: Public Records
Tax History Compared to Growth
Tax History
| Year | Tax Paid | Tax Assessment Tax Assessment Total Assessment is a certain percentage of the fair market value that is determined by local assessors to be the total taxable value of land and additions on the property. | Land | Improvement |
|---|---|---|---|---|
| 2024 | $5,050 | $72,340 | $12,760 | $59,580 |
| 2023 | $5,050 | $72,340 | $12,760 | $59,580 |
| 2022 | $4,395 | $53,430 | $9,450 | $43,980 |
| 2021 | $4,147 | $53,430 | $9,450 | $43,980 |
| 2020 | $3,877 | $50,860 | $9,450 | $41,410 |
| 2019 | $3,644 | $43,260 | $10,500 | $32,760 |
| 2018 | $3,618 | $43,260 | $10,500 | $32,760 |
| 2017 | $3,596 | $43,260 | $10,500 | $32,760 |
| 2016 | $3,260 | $37,580 | $10,500 | $27,080 |
| 2015 | $3,205 | $37,580 | $10,500 | $27,080 |
| 2014 | $3,205 | $37,580 | $10,500 | $27,080 |
| 2012 | -- | $40,250 | $10,500 | $29,750 |
Source: Public Records
Map
Nearby Homes
- 2334 Mardell Dr
- 2207 Southlea Dr
- 7806 Washington Park Dr
- 2560 Delavan Dr
- 1817 Provincetown Rd
- 488 Crossing Ln
- 550 Crossing Ln
- 7061 Rivendell Cir
- 7055 Rivendell Cir
- 3091 Simpson Ct
- 3057 Wellington Ln Unit 8264
- Yeats Plan at Chamberlin Crossing
- Turnbull Plan at Chamberlin Crossing
- 3052 Simpson Ct
- 3052 Simpson Ct Unit 8337
- 3091 Simpson Ct Unit 8355
- 488 Crossing Ln
- Remington Plan at Chamberlin Crossing
- 460 Crossing Ln
- Salinger Plan at Chamberlin Crossing
- 2355 Wymore Place
- 2343 Wymore Place
- 2361 Wymore Place
- 2313 Wymore Place
- 2312 Delvue Dr
- 2306 Delvue Dr
- 2318 Delvue Dr
- 2348 Wymore Place
- 2354 Wymore Place
- 2369 Wymore Place
- 2342 Wymore Place
- 2300 Delvue Dr
- 2336 Wymore Place
- 7550 Mad River Rd
- 2366 Wymore Place
- 2324 Delvue Dr
- 7570 Mad River Rd
- 2312 Wymore Place
- 2306 Wymore Place
- 2300 Wymore Place