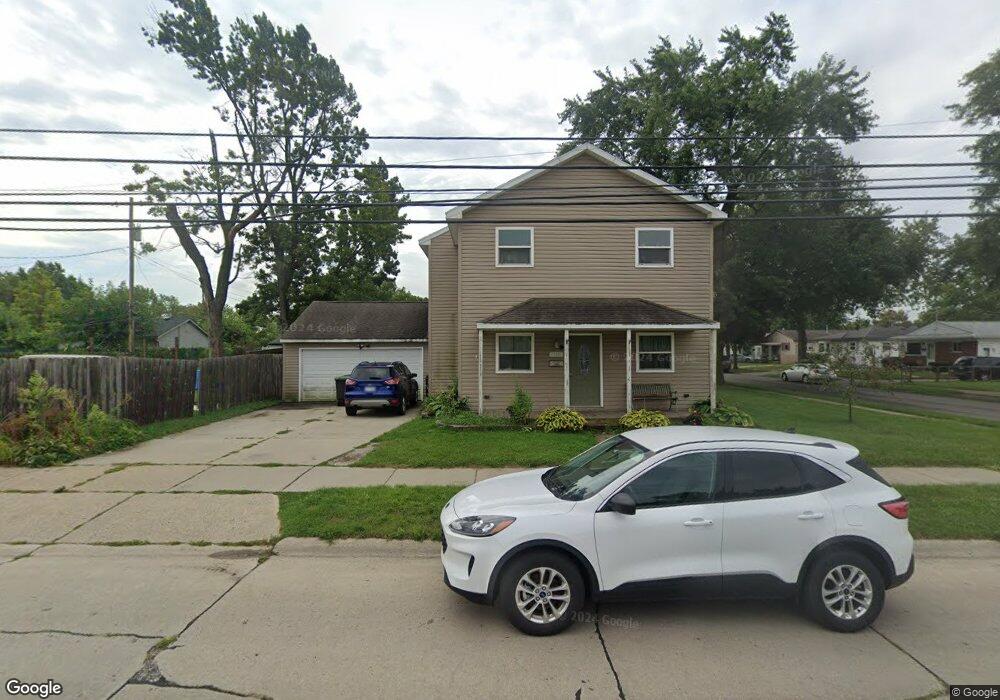
23495 Cypress St Taylor, MI 48180
Estimated Value: $189,000 - $217,000
3
Beds
1
Bath
1,763
Sq Ft
$114/Sq Ft
Est. Value
About This Home
This home is located at 23495 Cypress St, Taylor, MI 48180 and is currently estimated at $201,243, approximately $114 per square foot. 23495 Cypress St is a home located in Wayne County with nearby schools including Clarence Randall Elementary School, Hoover Middle School, and Quest Charter Academy.
Ownership History
Date
Name
Owned For
Owner Type
Purchase Details
Closed on
Nov 20, 2014
Sold by
Brock Curtis and Brock Glenda
Bought by
Brock Scott and Brock Nichole
Current Estimated Value
Home Financials for this Owner
Home Financials are based on the most recent Mortgage that was taken out on this home.
Original Mortgage
$45,000
Outstanding Balance
$15,285
Interest Rate
3.97%
Mortgage Type
New Conventional
Estimated Equity
$185,958
Purchase Details
Closed on
Jan 11, 2012
Sold by
Brock Scott
Bought by
Brock Scott and Brock Curtis
Purchase Details
Closed on
Sep 8, 2010
Sold by
Zorn Richard A
Bought by
The Bank Of New York Mellon and The Bank Of New York
Purchase Details
Closed on
Feb 11, 2000
Sold by
Rybski Karolyn
Bought by
Zorn Richard A
Create a Home Valuation Report for This Property
The Home Valuation Report is an in-depth analysis detailing your home's value as well as a comparison with similar homes in the area
Home Values in the Area
Average Home Value in this Area
Purchase History
| Date | Buyer | Sale Price | Title Company |
|---|---|---|---|
| Brock Scott | -- | Minnesota Title Agency | |
| Brock Scott | -- | None Available | |
| The Bank Of New York Mellon | $151,945 | None Available | |
| Zorn Richard A | $100,000 | -- |
Source: Public Records
Mortgage History
| Date | Status | Borrower | Loan Amount |
|---|---|---|---|
| Open | Brock Scott | $45,000 |
Source: Public Records
Tax History Compared to Growth
Tax History
| Year | Tax Paid | Tax Assessment Tax Assessment Total Assessment is a certain percentage of the fair market value that is determined by local assessors to be the total taxable value of land and additions on the property. | Land | Improvement |
|---|---|---|---|---|
| 2025 | $2,441 | $111,700 | $0 | $0 |
| 2024 | $2,441 | $100,300 | $0 | $0 |
| 2023 | $2,330 | $90,700 | $0 | $0 |
| 2022 | $2,330 | $83,400 | $0 | $0 |
| 2021 | $2,573 | $76,800 | $0 | $0 |
| 2020 | $2,547 | $69,200 | $0 | $0 |
| 2019 | $254,595 | $56,800 | $0 | $0 |
| 2018 | $2,001 | $48,100 | $0 | $0 |
| 2017 | $1,623 | $48,900 | $0 | $0 |
| 2016 | $2,486 | $47,500 | $0 | $0 |
| 2015 | $4,520 | $45,200 | $0 | $0 |
| 2013 | $3,550 | $36,700 | $0 | $0 |
| 2012 | $1,523 | $36,300 | $14,700 | $21,600 |
Source: Public Records
Map
Nearby Homes