23495 N Snuff Valley Rd Cary, IL 60013
Lyons Prairie NeighborhoodEstimated Value: $296,000 - $350,000
--
Bed
1
Bath
1,685
Sq Ft
$192/Sq Ft
Est. Value
About This Home
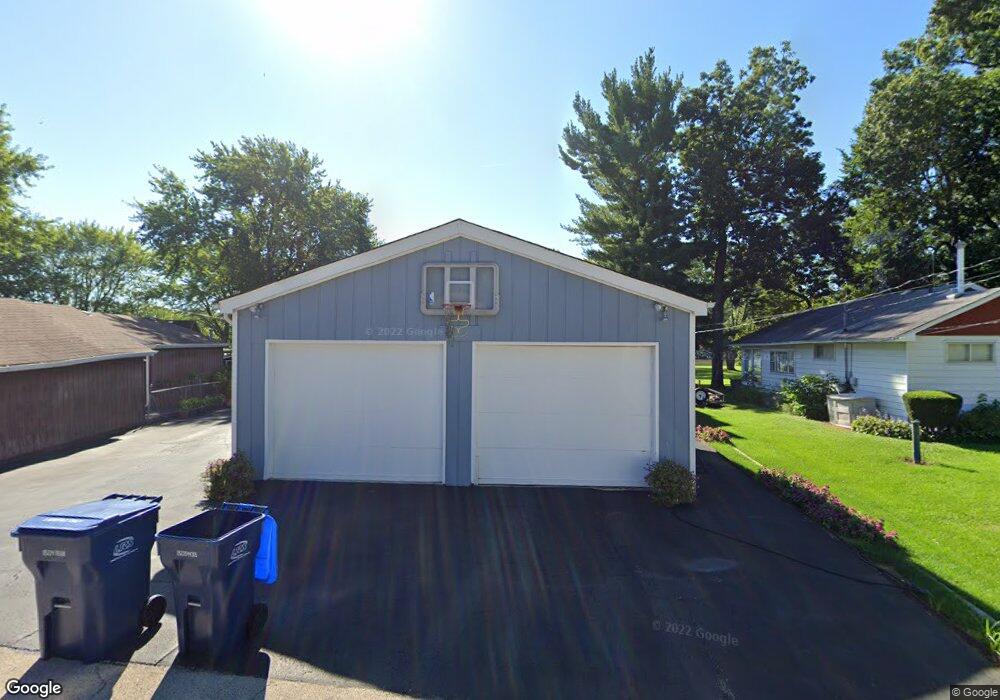
This home is located at 23495 N Snuff Valley Rd, Cary, IL 60013 and is currently estimated at $323,878, approximately $192 per square foot. 23495 N Snuff Valley Rd is a home located in Lake County with nearby schools including Deer Path Elementary School, Cary Jr High School, and Cary Grove High School.
Ownership History
Date
Name
Owned For
Owner Type
Purchase Details
Closed on
Nov 16, 1995
Sold by
Sturtevant Sturtevant Jr Arthur P Jr Arthur P and Sturtevant Hw Carol
Bought by
Ehlers Roger M and Ehlers Jane G
Current Estimated Value
Home Financials for this Owner
Home Financials are based on the most recent Mortgage that was taken out on this home.
Original Mortgage
$162,000
Outstanding Balance
$2,277
Interest Rate
7.65%
Estimated Equity
$321,601
Purchase Details
Closed on
Nov 6, 1995
Sold by
Sturtevant Arthur P and Sturtevant Carol
Bought by
Sturtevant Arthur P and Sturtevant Carol
Home Financials for this Owner
Home Financials are based on the most recent Mortgage that was taken out on this home.
Original Mortgage
$162,000
Outstanding Balance
$2,277
Interest Rate
7.65%
Estimated Equity
$321,601
Create a Home Valuation Report for This Property
The Home Valuation Report is an in-depth analysis detailing your home's value as well as a comparison with similar homes in the area
Home Values in the Area
Average Home Value in this Area
Purchase History
| Date | Buyer | Sale Price | Title Company |
|---|---|---|---|
| Ehlers Roger M | $202,500 | Chicago Title Insurance Co | |
| Sturtevant Arthur P | -- | Chicago Title Insurance Co |
Source: Public Records
Mortgage History
| Date | Status | Borrower | Loan Amount |
|---|---|---|---|
| Open | Ehlers Roger M | $162,000 |
Source: Public Records
Tax History Compared to Growth
Tax History
| Year | Tax Paid | Tax Assessment Tax Assessment Total Assessment is a certain percentage of the fair market value that is determined by local assessors to be the total taxable value of land and additions on the property. | Land | Improvement |
|---|---|---|---|---|
| 2024 | $5,791 | $92,458 | $36,325 | $56,133 |
| 2023 | $5,189 | $87,638 | $34,431 | $53,207 |
| 2022 | $5,189 | $74,757 | $28,125 | $46,632 |
| 2021 | $5,209 | $73,486 | $27,647 | $45,839 |
| 2020 | $5,213 | $73,259 | $27,562 | $45,697 |
| 2019 | $5,244 | $71,326 | $26,835 | $44,491 |
| 2018 | $5,491 | $73,490 | $34,031 | $39,459 |
| 2017 | $5,530 | $72,013 | $33,347 | $38,666 |
| 2016 | $5,543 | $69,296 | $32,089 | $37,207 |
| 2015 | $5,481 | $64,994 | $30,097 | $34,897 |
| 2014 | $5,899 | $69,484 | $32,232 | $37,252 |
| 2012 | $5,575 | $70,678 | $32,786 | $37,892 |
Source: Public Records
Map
Nearby Homes
- 28876 W Pioneer Grove Rd
- 28629 W Ravine Dr
- 23433 N Summit Dr
- 28437 W Lindbergh Dr
- 28971 W Fox St
- 28442 W Main St
- Lot 1 N Owl Ct
- 911 Johnson St
- 9209 Jasmine Way
- 28740 W Bloners Dr
- 24211 N Riverside Dr
- 806 Norge Pkwy
- 0000 Newbold Rd
- 902 Spring Beach Way
- 503 N River Rd
- 502 Windsor Cir
- 5 Jacqueline Ln
- 300 Opatrny Dr Unit 122
- 1107 Spring Beach Way
- Lot 7 Hickory Nut Grove Rd
- 23485 N Snuff Valley Rd
- 23502 N Snuff Valley Rd
- 23501 N Snuff Valley Rd
- 23494 N Snuff Valley Rd
- 23471 N Snuff Valley Rd
- 23514 N Snuff Valley Rd
- 23505 N Snuff Valley Rd
- 23415 N Snuff Valley Rd
- 23484 N Snuff Valley Rd
- 23526 N Snuff Valley Rd
- 23457 N Snuff Valley Rd
- 23519 N Snuff Valley Rd
- 23534 N Snuff Valley Rd
- 23470 N Snuff Valley Rd
- 23443 N Snuff Valley Rd
- 23531 N Snuff Valley Rd
- 23458 N Snuff Valley Rd
- 23543 N Snuff Valley Rd
- 23429 N Snuff Valley Rd
- 23444 N Snuff Valley Rd