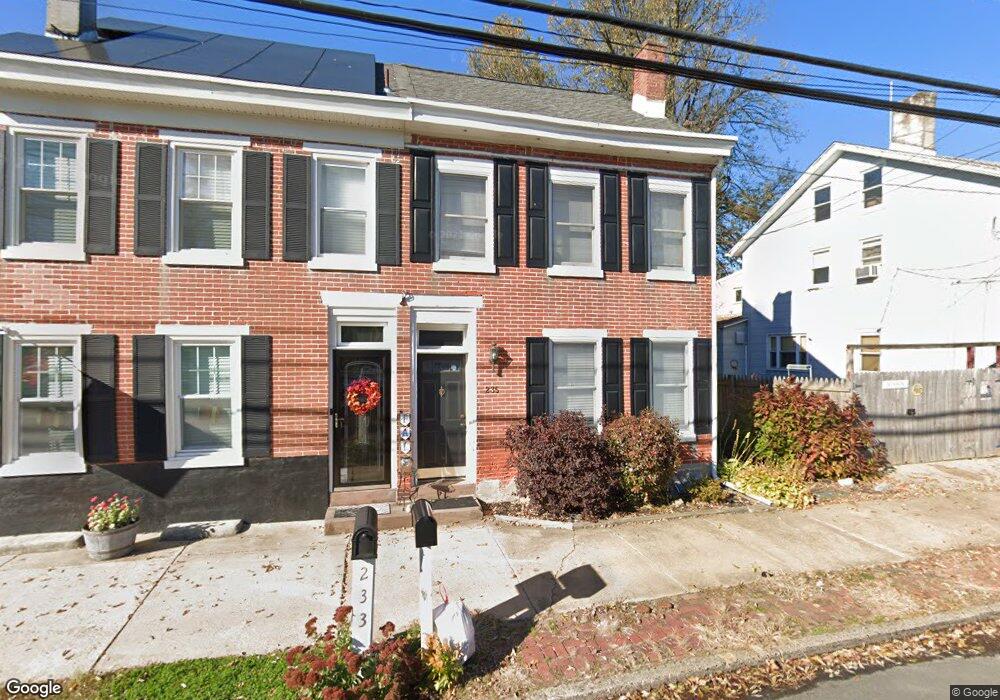
235 4th St Fieldsboro, NJ 08505
Estimated Value: $254,147 - $343,000
2
Beds
--
Bath
1,000
Sq Ft
$314/Sq Ft
Est. Value
About This Home
This property at 235 4th St features 2 bedrooms and 2 bathrooms within a total of 1,000 square feet. The living room offers ample space for relaxation, while the bedrooms provide comfortable accommodations. Each bathroom is equipped with a tub/shower combination. The kitchen includes a dishwasher for convenience, and there are washer/dryer hookups available. The property is smoke-free and includes ceiling fans for climate control. Outside, there is a yard for outdoor activities. This listing is ideal for those seeking a functional and well-equipped living space in a central location with easy access to 295/130/206 and Turnpike
Ownership History
Date
Name
Owned For
Owner Type
Purchase Details
Closed on
Apr 15, 1987
Bought by
Lynch Rose Marie
Current Estimated Value
Create a Home Valuation Report for This Property
The Home Valuation Report is an in-depth analysis detailing your home's value as well as a comparison with similar homes in the area
Home Values in the Area
Average Home Value in this Area
Purchase History
| Date | Buyer | Sale Price | Title Company |
|---|---|---|---|
| Lynch Rose Marie | $57,000 | -- |
Source: Public Records
Property History
| Date | Event | Price | List to Sale | Price per Sq Ft |
|---|---|---|---|---|
| 05/27/2025 05/27/25 | Off Market | $1,950 | -- | -- |
| 04/16/2025 04/16/25 | For Rent | $1,950 | -- | -- |
Tax History
| Year | Tax Paid | Tax Assessment Tax Assessment Total Assessment is a certain percentage of the fair market value that is determined by local assessors to be the total taxable value of land and additions on the property. | Land | Improvement |
|---|---|---|---|---|
| 2025 | $4,364 | $144,500 | $43,500 | $101,000 |
| 2024 | $4,205 | $144,500 | $43,500 | $101,000 |
| 2023 | $4,205 | $144,500 | $43,500 | $101,000 |
| 2022 | $4,258 | $144,500 | $43,500 | $101,000 |
| 2021 | $4,354 | $144,500 | $43,500 | $101,000 |
| 2020 | $4,167 | $144,500 | $43,500 | $101,000 |
| 2019 | $4,151 | $144,500 | $43,500 | $101,000 |
| 2018 | $4,167 | $144,500 | $43,500 | $101,000 |
| 2017 | $3,942 | $144,500 | $43,500 | $101,000 |
| 2016 | $3,810 | $144,500 | $43,500 | $101,000 |
| 2015 | $3,737 | $144,500 | $43,500 | $101,000 |
| 2014 | $3,582 | $144,500 | $43,500 | $101,000 |
Source: Public Records
Map
Nearby Homes
- 202 Union St
- 229 Washington St
- 213 Front St
- 212 River Ct
- 43 Allegheny Ln
- 59 Seneca Ln
- 43 Meadow Run Rd
- 39 Tantum Ct
- 422 Prince St
- 514 Prince St
- 365 Prince St
- 6 W Church St
- 600 Farnsworth Ave
- 319 Borden St
- 310 Hopkinson St
- 51 Mary St
- 70 E Park St Unit 1-11
- 124 E Burlington St
- 10 Roberts Ct
- 13 Ticonderoga Dr
Your Personal Tour Guide
Ask me questions while you tour the home.