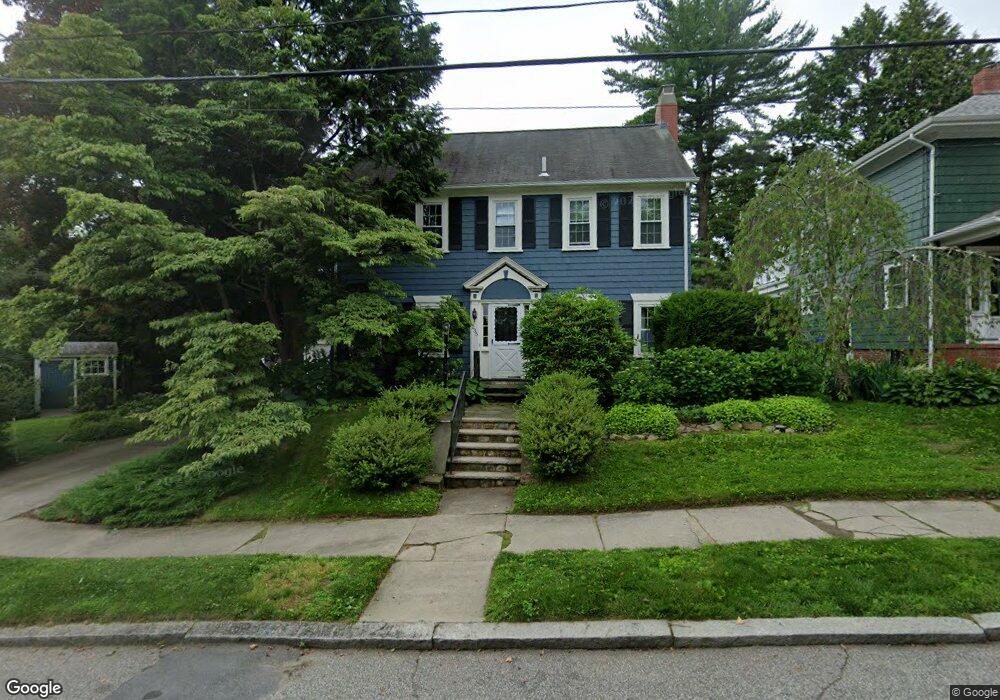
235 4th St Providence, RI 02906
Blackstone NeighborhoodEstimated Value: $774,166 - $905,000
3
Beds
2
Baths
1,696
Sq Ft
$500/Sq Ft
Est. Value
About This Home
This home is located at 235 4th St, Providence, RI 02906 and is currently estimated at $848,042, approximately $500 per square foot. 235 4th St is a home located in Providence County with nearby schools including Jewish Community Day School Of Rhode Island, Moses Brown School, and Montessori Childrens House.
Ownership History
Date
Name
Owned For
Owner Type
Purchase Details
Closed on
Jun 2, 2008
Sold by
Cable Robert
Bought by
Eberstadt Kathryn and Shapiro Gerald M
Current Estimated Value
Home Financials for this Owner
Home Financials are based on the most recent Mortgage that was taken out on this home.
Original Mortgage
$219,000
Outstanding Balance
$138,909
Interest Rate
5.91%
Mortgage Type
Purchase Money Mortgage
Estimated Equity
$709,133
Purchase Details
Closed on
Sep 29, 1989
Sold by
Est Olson Ernest A
Bought by
Cable Robert C
Home Financials for this Owner
Home Financials are based on the most recent Mortgage that was taken out on this home.
Original Mortgage
$157,000
Interest Rate
9.92%
Create a Home Valuation Report for This Property
The Home Valuation Report is an in-depth analysis detailing your home's value as well as a comparison with similar homes in the area
Home Values in the Area
Average Home Value in this Area
Purchase History
| Date | Buyer | Sale Price | Title Company |
|---|---|---|---|
| Eberstadt Kathryn | $419,000 | -- | |
| Cable Robert C | $174,500 | -- |
Source: Public Records
Mortgage History
| Date | Status | Borrower | Loan Amount |
|---|---|---|---|
| Open | Cable Robert C | $219,000 | |
| Previous Owner | Cable Robert C | $197,000 | |
| Previous Owner | Cable Robert C | $144,000 | |
| Previous Owner | Cable Robert C | $157,000 |
Source: Public Records
Tax History
| Year | Tax Paid | Tax Assessment Tax Assessment Total Assessment is a certain percentage of the fair market value that is determined by local assessors to be the total taxable value of land and additions on the property. | Land | Improvement |
|---|---|---|---|---|
| 2025 | $6,069 | $722,500 | $395,600 | $326,900 |
| 2024 | $10,685 | $582,300 | $266,600 | $315,700 |
| 2023 | $10,685 | $582,300 | $266,600 | $315,700 |
| 2022 | $10,365 | $582,300 | $266,600 | $315,700 |
| 2021 | $11,661 | $474,800 | $225,200 | $249,600 |
| 2020 | $11,661 | $474,800 | $225,200 | $249,600 |
| 2019 | $11,661 | $474,800 | $225,200 | $249,600 |
| 2018 | $13,682 | $428,100 | $195,000 | $233,100 |
| 2017 | $13,682 | $428,100 | $195,000 | $233,100 |
| 2016 | $13,682 | $428,100 | $195,000 | $233,100 |
| 2015 | $12,823 | $387,400 | $182,000 | $205,400 |
| 2013 | $12,184 | $361,000 | $182,000 | $179,000 |
Source: Public Records
Map
Nearby Homes
- 62 Harwich Rd
- 39 Harwich Rd
- 202 Rochambeau Ave Unit 2
- 540 Blackstone Blvd
- 15 Taft Ave
- 89 Dexterdale Rd
- 6 Alfred Stone Rd
- 296 Cole Ave
- 136 Hillside Ave
- 80 Hillside Ave
- 103 Evergreen St
- 94 Larch St
- 4 Mount Ave
- 101 Grand View St Unit 1
- 32 Carver St
- 219 Cole Ave
- 25 Tecumseh St
- 122 Lowden St
- 33 Evergreen St
- 80 Clarendon Ave
Your Personal Tour Guide
Ask me questions while you tour the home.