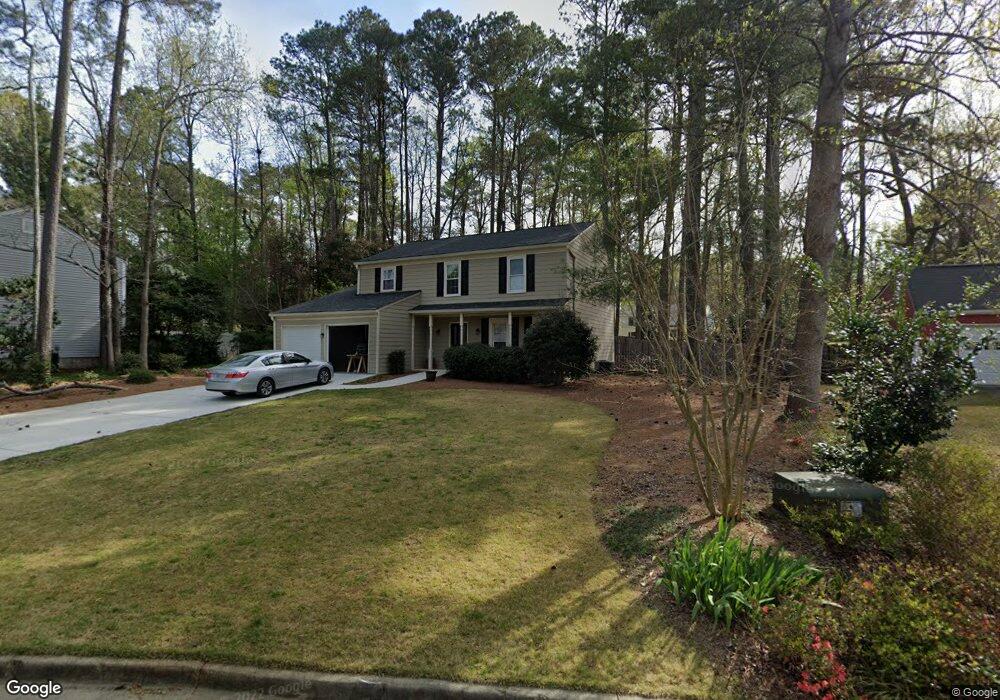
235 Barrington Dr E Unit 4 Roswell, GA 30076
Barrington NeighborhoodEstimated Value: $478,208 - $525,000
4
Beds
3
Baths
1,508
Sq Ft
$334/Sq Ft
Est. Value
About This Home
This home is located at 235 Barrington Dr E Unit 4, Roswell, GA 30076 and is currently estimated at $503,302, approximately $333 per square foot. 235 Barrington Dr E Unit 4 is a home located in Fulton County with nearby schools including Northwood Elementary School, Haynes Bridge Middle School, and Centennial High School.
Ownership History
Date
Name
Owned For
Owner Type
Purchase Details
Closed on
Feb 5, 2018
Sold by
Jenkins Jess
Bought by
Jenkins Jess and Jenkins Marcy Lynn
Current Estimated Value
Home Financials for this Owner
Home Financials are based on the most recent Mortgage that was taken out on this home.
Original Mortgage
$283,500
Outstanding Balance
$239,857
Interest Rate
3.95%
Mortgage Type
New Conventional
Estimated Equity
$263,445
Purchase Details
Closed on
Oct 2, 2017
Sold by
Landeck Tina M
Bought by
July Homes Inc
Purchase Details
Closed on
Feb 28, 2013
Sold by
Altman Melissa
Bought by
Landeck Tina M
Home Financials for this Owner
Home Financials are based on the most recent Mortgage that was taken out on this home.
Original Mortgage
$176,641
Interest Rate
3.25%
Mortgage Type
FHA
Purchase Details
Closed on
Sep 11, 2000
Sold by
Sebenick Joseph U
Bought by
Sebenick Maureen K
Create a Home Valuation Report for This Property
The Home Valuation Report is an in-depth analysis detailing your home's value as well as a comparison with similar homes in the area
Home Values in the Area
Average Home Value in this Area
Purchase History
| Date | Buyer | Sale Price | Title Company |
|---|---|---|---|
| Jenkins Jess | -- | -- | |
| Jenkins Jess | $315,000 | -- | |
| July Homes Inc | $200,000 | -- | |
| Landeck Tina M | $179,900 | -- | |
| Sebenick Maureen K | $5,000 | -- |
Source: Public Records
Mortgage History
| Date | Status | Borrower | Loan Amount |
|---|---|---|---|
| Open | Jenkins Jess | $283,500 | |
| Closed | Jenkins Jess | $283,500 | |
| Previous Owner | Landeck Tina M | $176,641 |
Source: Public Records
Tax History Compared to Growth
Tax History
| Year | Tax Paid | Tax Assessment Tax Assessment Total Assessment is a certain percentage of the fair market value that is determined by local assessors to be the total taxable value of land and additions on the property. | Land | Improvement |
|---|---|---|---|---|
| 2025 | $639 | $160,120 | $39,640 | $120,480 |
| 2023 | $4,533 | $160,600 | $40,360 | $120,240 |
| 2022 | $2,693 | $139,240 | $25,520 | $113,720 |
| 2021 | $3,199 | $117,720 | $29,120 | $88,600 |
| 2020 | $3,240 | $110,920 | $27,240 | $83,680 |
| 2019 | $540 | $108,960 | $26,760 | $82,200 |
| 2018 | $2,258 | $80,000 | $17,280 | $62,720 |
| 2017 | $2,139 | $73,320 | $12,640 | $60,680 |
| 2016 | $2,140 | $73,320 | $12,640 | $60,680 |
| 2015 | $2,482 | $71,400 | $12,640 | $58,760 |
| 2014 | $2,189 | $71,400 | $12,640 | $58,760 |
Source: Public Records
Map
Nearby Homes
- 105 Laurel Mill Ct
- 680 Barrington Way
- 500 Barrington Dr W
- 485 Sheringham Ct
- 515 Forest Place
- 1095 Northpointe Trace
- 650 Lake Forest Ct
- 620 Lake Forest Ct
- 295 Crab Orchard Way
- 780 Crab Orchard Dr
- 590 Sheringham Ct
- 435 Sheringham Terrace
- 9985 Lake Forest Way
- 1250 Atherton Park
- 500 Cranberry Place Unit 6
- 600 Jardin Ct Unit 48
- 2020 Jardin Ct Unit 1
- 260 Spring Ridge Dr
- 235 Barrington Dr E
- 225 Barrington Dr E
- 840 Laurel Mill Dr
- 215 Barrington Dr E Unit 3
- 215 Barrington Dr E
- 230 Barrington Dr E
- 830 Crab Orchard Ct
- 850 Laurel Mill Dr
- 220 Barrington Dr E
- 240 Barrington Dr E
- 820 Crab Orchard Ct
- 820 Crab Orchard Ct
- 125 Laurel Mill Ct
- 130 Laurel Mill Ct
- 205 Barrington Dr E Unit 191
- 205 Barrington Dr E
- 250 Barrington Dr E
- 210 Barrington Dr E
- 810 Crab Orchard Ct
- 810 Crab Orchard Ct