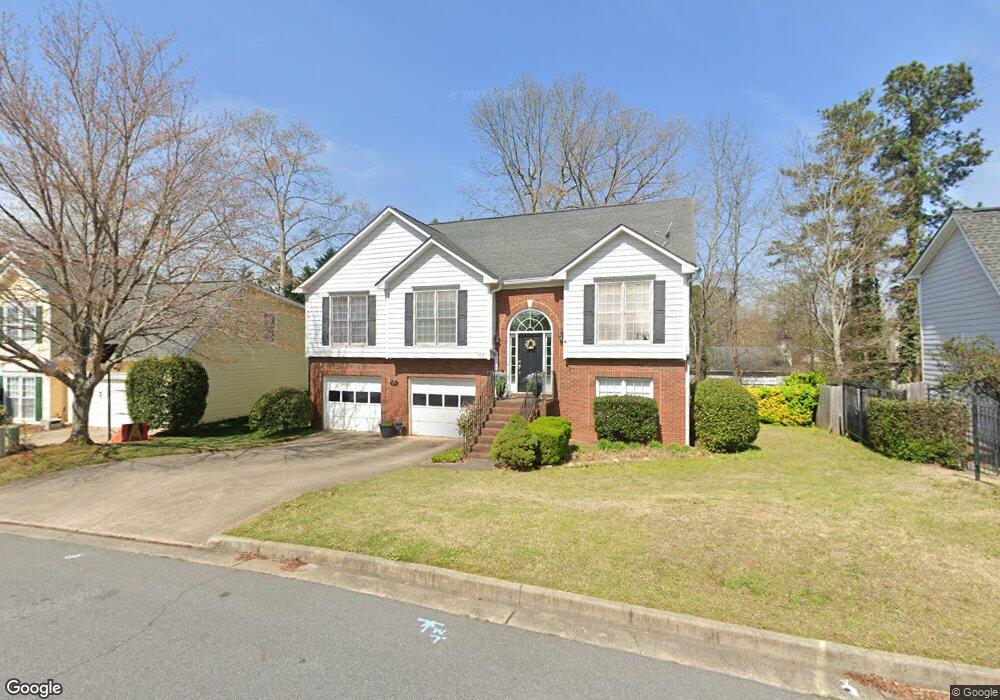
235 Boca Ciega Ct Unit 2 Alpharetta, GA 30022
Estimated Value: $538,062 - $590,000
4
Beds
3
Baths
1,848
Sq Ft
$300/Sq Ft
Est. Value
About This Home
This home is located at 235 Boca Ciega Ct Unit 2, Alpharetta, GA 30022 and is currently estimated at $555,016, approximately $300 per square foot. 235 Boca Ciega Ct Unit 2 is a home located in Fulton County with nearby schools including State Bridge Crossing Elementary School, Taylor Road Middle School, and Chattahoochee High School.
Ownership History
Date
Name
Owned For
Owner Type
Purchase Details
Closed on
Apr 30, 2013
Sold by
Crivellone Donald
Bought by
Barr Kimberly Crivellone and Barr Kenneth R
Current Estimated Value
Home Financials for this Owner
Home Financials are based on the most recent Mortgage that was taken out on this home.
Original Mortgage
$116,000
Outstanding Balance
$82,493
Interest Rate
3.56%
Mortgage Type
New Conventional
Estimated Equity
$472,523
Purchase Details
Closed on
Jun 8, 1993
Sold by
Cheek Derrick
Bought by
Crivellone Donald P Robin
Home Financials for this Owner
Home Financials are based on the most recent Mortgage that was taken out on this home.
Original Mortgage
$137,700
Interest Rate
7.5%
Mortgage Type
VA
Create a Home Valuation Report for This Property
The Home Valuation Report is an in-depth analysis detailing your home's value as well as a comparison with similar homes in the area
Home Values in the Area
Average Home Value in this Area
Purchase History
| Date | Buyer | Sale Price | Title Company |
|---|---|---|---|
| Barr Kimberly Crivellone | $145,000 | -- | |
| Crivellone Donald P Robin | $137,700 | -- |
Source: Public Records
Mortgage History
| Date | Status | Borrower | Loan Amount |
|---|---|---|---|
| Open | Barr Kimberly Crivellone | $116,000 | |
| Previous Owner | Crivellone Donald P Robin | $137,700 |
Source: Public Records
Tax History Compared to Growth
Tax History
| Year | Tax Paid | Tax Assessment Tax Assessment Total Assessment is a certain percentage of the fair market value that is determined by local assessors to be the total taxable value of land and additions on the property. | Land | Improvement |
|---|---|---|---|---|
| 2025 | $6,195 | $257,200 | $38,520 | $218,680 |
| 2023 | $5,633 | $199,560 | $31,240 | $168,320 |
| 2022 | $4,696 | $153,040 | $32,960 | $120,080 |
| 2021 | $4,263 | $135,320 | $27,240 | $108,080 |
| 2020 | $4,304 | $133,720 | $26,920 | $106,800 |
| 2019 | $518 | $131,360 | $26,440 | $104,920 |
| 2018 | $3,632 | $111,520 | $18,480 | $93,040 |
| 2017 | $3,239 | $95,160 | $12,720 | $82,440 |
| 2016 | $3,192 | $95,160 | $12,720 | $82,440 |
| 2015 | $3,227 | $95,160 | $12,720 | $82,440 |
| 2014 | $2,045 | $57,980 | $7,740 | $50,240 |
Source: Public Records
Map
Nearby Homes
- 5022 Anclote Dr
- 4965 Cinnabar Dr
- 4815 Tanners Spring Dr
- 5060 Cinnabar Dr
- 4965 N Bridges Dr
- 225 Morton Creek Cir
- 10840 Mortons Crossing
- 4740 Carversham Way
- 10906 Gallier St
- 130 Douglas Fir Ct Unit 1
- 4790 Roswell Mill Dr
- 220 Magnolia Tree Ct
- 465 Mikasa Dr
- 120 Donamere Ct
- 11150 Highfield Chase Dr
- 165 Morton Walk Dr Unit 1
- 5425 Taylor Rd Unit 2
- 230 Pinebridge Ct
- 11390 Ridge Hill Dr
- 11125 Linbrook Ln
- 225 Boca Ciega Ct
- 245 Boca Ciega Ct Unit II
- 0 Boca Ciega Ct Unit 7475463
- 0 Boca Ciega Ct Unit 8148858
- 0 Boca Ciega Ct Unit 7273014
- 0 Boca Ciega Ct Unit 8963373
- 0 Boca Ciega Ct Unit 7053158
- 0 Boca Ciega Ct
- 4931 Anclote Dr
- 4921 Anclote Dr
- 4921 Anclote Dr Unit 1
- 240 Boca Ciega Ct
- 4941 Anclote Dr
- 4911 Anclote Dr
- 215 Boca Ciega Ct
- 215 Boca Ciega Ct Unit 2
- 255 Boca Ciega Ct
- 250 Boca Ciega Ct
- 230 Boca Ciega Ct
- 4951 Anclote Dr