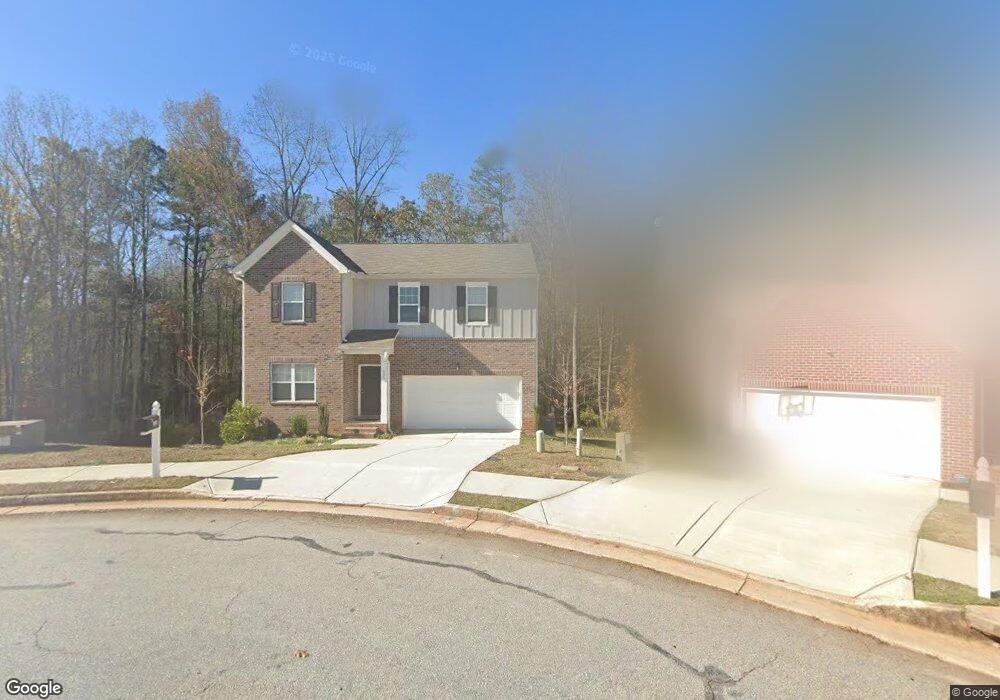
235 Bowen Way Unit 91 Covington, GA 30016
Estimated Value: $322,000 - $396,000
4
Beds
3
Baths
2,516
Sq Ft
$140/Sq Ft
Est. Value
About This Home
This home is located at 235 Bowen Way Unit 91, Covington, GA 30016 and is currently estimated at $351,113, approximately $139 per square foot. 235 Bowen Way Unit 91 is a home located in Newton County with nearby schools including Live Oak Elementary School, Clements Middle School, and Newton High School.
Ownership History
Date
Name
Owned For
Owner Type
Purchase Details
Closed on
May 13, 2022
Sold by
Mile High Borrower 1 Income Llc
Bought by
Mile High Tl Borrower 1 Income Llc
Current Estimated Value
Purchase Details
Closed on
Apr 22, 2021
Sold by
Bostic Undrey Macre
Bought by
Mile High Borrower 1 Income Llc
Purchase Details
Closed on
Aug 6, 2020
Sold by
Starlight Homes Georgia Llc
Bought by
Bostic Undrey Macre
Home Financials for this Owner
Home Financials are based on the most recent Mortgage that was taken out on this home.
Original Mortgage
$251,000
Interest Rate
3%
Mortgage Type
VA
Purchase Details
Closed on
Apr 26, 2019
Sold by
Neely Manor Partners 4 Llc
Bought by
Starlight Homes Georgia Llc
Purchase Details
Closed on
Dec 19, 2017
Sold by
Rl Regi Ga Mhu Llc
Bought by
Neely Manor Patners 4 Llc
Create a Home Valuation Report for This Property
The Home Valuation Report is an in-depth analysis detailing your home's value as well as a comparison with similar homes in the area
Home Values in the Area
Average Home Value in this Area
Purchase History
| Date | Buyer | Sale Price | Title Company |
|---|---|---|---|
| Mile High Tl Borrower 1 Income Llc | -- | -- | |
| Mile High Borrower 1 Income Llc | $295,000 | -- | |
| Bostic Undrey Macre | $251,000 | -- | |
| Starlight Homes Georgia Llc | $2,091,259 | -- | |
| Neely Manor Patners 4 Llc | $363,000 | -- |
Source: Public Records
Mortgage History
| Date | Status | Borrower | Loan Amount |
|---|---|---|---|
| Previous Owner | Bostic Undrey Macre | $251,000 |
Source: Public Records
Tax History Compared to Growth
Tax History
| Year | Tax Paid | Tax Assessment Tax Assessment Total Assessment is a certain percentage of the fair market value that is determined by local assessors to be the total taxable value of land and additions on the property. | Land | Improvement |
|---|---|---|---|---|
| 2024 | $3,510 | $136,320 | $20,000 | $116,320 |
| 2023 | $4,002 | $145,360 | $9,600 | $135,760 |
| 2022 | $3,259 | $118,000 | $9,600 | $108,400 |
| 2021 | $2,984 | $102,680 | $9,600 | $93,080 |
| 2020 | $1,838 | $54,720 | $9,600 | $45,120 |
| 2019 | $229 | $6,720 | $6,720 | $0 |
| 2018 | $231 | $6,720 | $6,720 | $0 |
| 2017 | $198 | $5,760 | $5,760 | $0 |
| 2016 | $157 | $4,560 | $4,560 | $0 |
| 2015 | $133 | $2,280 | $2,280 | $0 |
| 2014 | $113 | $1,680 | $0 | $0 |
Source: Public Records
Map
Nearby Homes
- 225 Bowen Way
- 245 Bowen Way
- 230 Bowen Way
- 215 Bowen Way
- 220 Bowen Way
- 210 Bowen Way
- 205 Bowen Way
- 200 Bowen Way
- 190 Bowen Way
- 215 Landon Way
- 195 Bowen Way
- 235 Landon Way
- 245 Landon Way
- 225 Landon Way
- 225 Landon Way Unit .
- 160 Cherohala Ct Unit 118
- 160 Cherohala Ct
- 180 Bowen Way
- 195 Landon Way Unit 36
- 195 Landon Way