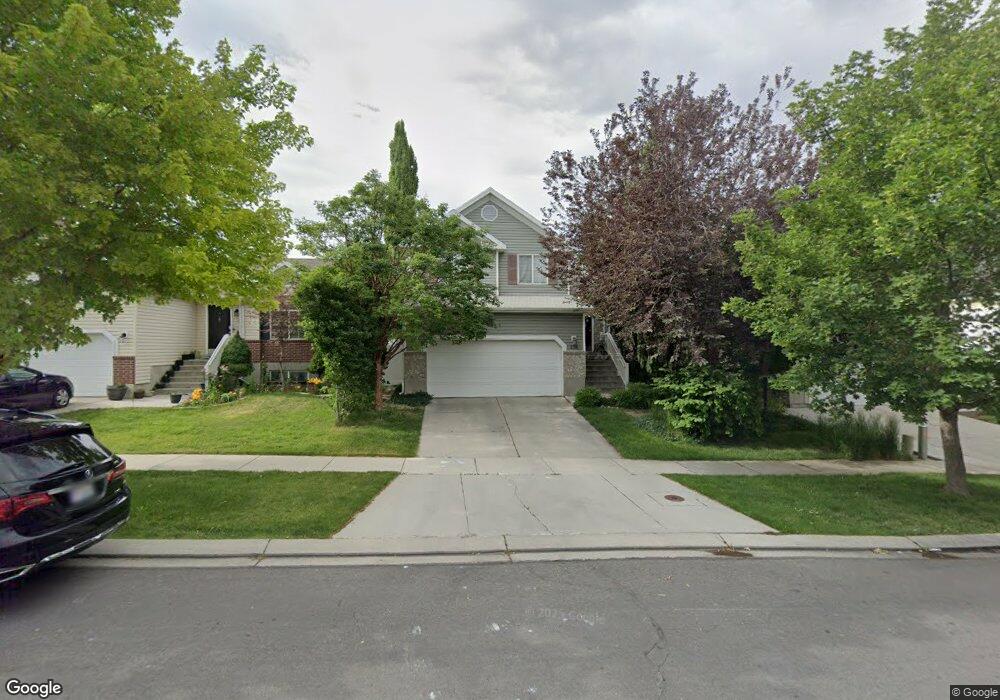
235 Bubbling Brook Ln Draper, UT 84020
Estimated Value: $538,000 - $580,000
3
Beds
2
Baths
1,989
Sq Ft
$282/Sq Ft
Est. Value
About This Home
This home is located at 235 Bubbling Brook Ln, Draper, UT 84020 and is currently estimated at $560,417, approximately $281 per square foot. 235 Bubbling Brook Ln is a home located in Salt Lake County with nearby schools including Crescent School, Mount Jordan Middle School, and American Preparatory Academy - Draper 2 Campus.
Ownership History
Date
Name
Owned For
Owner Type
Purchase Details
Closed on
Jul 26, 2021
Sold by
Coleman Elizabeth C and Burgess Elizabeth C
Bought by
Coleman Elizabeth Christine
Current Estimated Value
Home Financials for this Owner
Home Financials are based on the most recent Mortgage that was taken out on this home.
Original Mortgage
$220,000
Outstanding Balance
$200,138
Interest Rate
2.93%
Mortgage Type
New Conventional
Estimated Equity
$360,279
Purchase Details
Closed on
Sep 3, 2014
Sold by
Nicholson Christopher M and Nicholson Katherine A
Bought by
Burgess Elizabeth C
Home Financials for this Owner
Home Financials are based on the most recent Mortgage that was taken out on this home.
Original Mortgage
$219,900
Interest Rate
4.1%
Mortgage Type
New Conventional
Purchase Details
Closed on
Nov 21, 2001
Sold by
Rochelle Properties Lc
Bought by
Nicholson Christopher M and Nicholson Katherine A
Home Financials for this Owner
Home Financials are based on the most recent Mortgage that was taken out on this home.
Original Mortgage
$155,711
Interest Rate
6.57%
Create a Home Valuation Report for This Property
The Home Valuation Report is an in-depth analysis detailing your home's value as well as a comparison with similar homes in the area
Home Values in the Area
Average Home Value in this Area
Purchase History
| Date | Buyer | Sale Price | Title Company |
|---|---|---|---|
| Coleman Elizabeth Christine | -- | Us Title | |
| Burgess Elizabeth C | -- | First American Title | |
| Nicholson Christopher M | -- | Merrill Title |
Source: Public Records
Mortgage History
| Date | Status | Borrower | Loan Amount |
|---|---|---|---|
| Open | Coleman Elizabeth Christine | $220,000 | |
| Closed | Burgess Elizabeth C | $219,900 | |
| Previous Owner | Nicholson Christopher M | $155,711 |
Source: Public Records
Tax History
| Year | Tax Paid | Tax Assessment Tax Assessment Total Assessment is a certain percentage of the fair market value that is determined by local assessors to be the total taxable value of land and additions on the property. | Land | Improvement |
|---|---|---|---|---|
| 2025 | $2,532 | $556,400 | $148,500 | $407,900 |
| 2024 | $2,532 | $482,600 | $137,500 | $345,100 |
| 2023 | $2,829 | $469,400 | $130,700 | $338,700 |
| 2022 | $2,968 | $478,700 | $128,200 | $350,500 |
| 2021 | $2,393 | $350,800 | $101,000 | $249,800 |
| 2020 | $2,437 | $314,300 | $101,000 | $213,300 |
| 2019 | $2,157 | $290,600 | $95,500 | $195,100 |
| 2016 | $1,766 | $242,800 | $95,500 | $147,300 |
Source: Public Records
Map
Nearby Homes
- 269 W Beverlee Ann Dr Unit 11720
- 401 W Election Rd
- 11637 S Sky Atlas Ln
- 11781 S Halls Creek Rd
- 11749 S Halls Creek Rd
- 11737 S Halls Creek Rd
- 11711 S Halls Creek Rd
- 11673 S Halls Creek Rd
- 11718 S Halls Creek Rd
- 11708 S Engelmann Dr
- 11979 Draper Ridge Dr
- 11872 S Ridge Oak Ln
- 552 Sunset Crest Way
- 11617 S Wildrye Field Way
- 11566 S Junegrass Dr
- 504 W Maidengrass Way
- 186 E Kimballfield Ln
- 12026 S Fort Draper Ave
- 12235 S Ryder Ct
- 11544 Olive Berry Ln
- 235 W Bubbling Brook Ln
- 231 W Bubbling Brook Ln
- 239 W Bubbling Brook Ln
- 231 Bubbling Brook Ln
- 239 Bubbling Brook Ln
- 243 Bubbling Brook Ln
- 243 W Bubbling Brook Ln
- 227 Bubbling Brook Ln
- 254 W Inauguration Rd
- 254 Inauguration Rd
- 246 W Inauguration Rd
- 260 Inauguration Rd
- 240 Inauguration Rd
- 240 W Inauguration Rd
- 247 Bubbling Brook Ln
- 247 W Bubbling Brook Ln
- 266 W Inauguration Rd
- 266 Inauguration Rd
- 232 W Inauguration Rd
- 232 Inauguration Rd
Your Personal Tour Guide
Ask me questions while you tour the home.