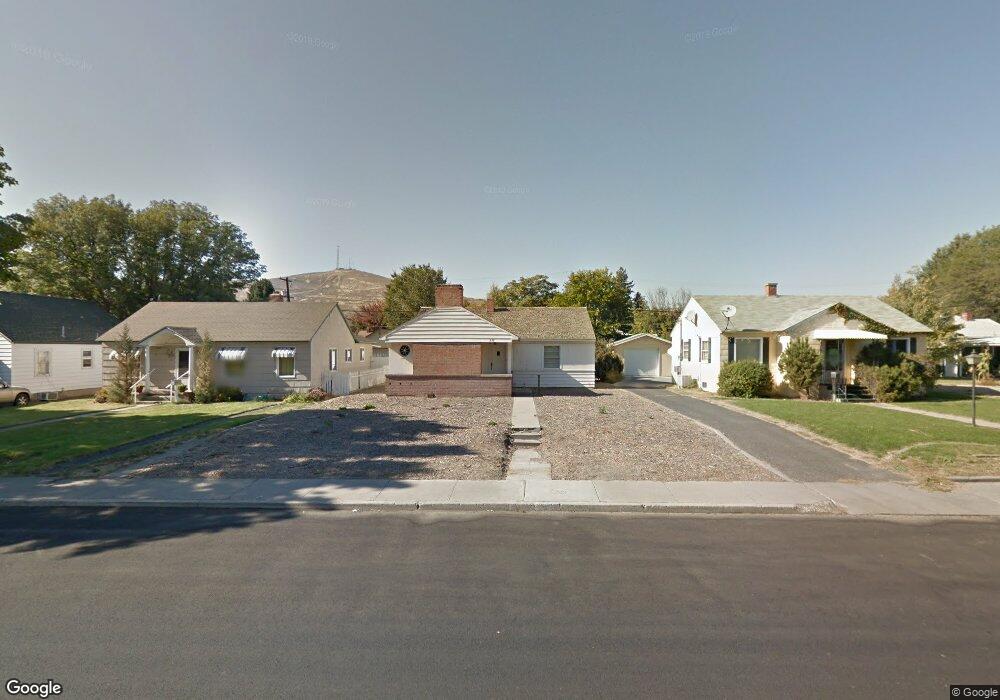
235 C St SW Ephrata, WA 98823
Estimated Value: $280,000 - $378,000
2
Beds
2
Baths
1,155
Sq Ft
$286/Sq Ft
Est. Value
About This Home
This home is located at 235 C St SW, Ephrata, WA 98823 and is currently estimated at $330,881, approximately $286 per square foot. 235 C St SW is a home located in Grant County with nearby schools including Ephrata High School, New Life Christian School, and St. Rose of Lima Catholic School.
Ownership History
Date
Name
Owned For
Owner Type
Purchase Details
Closed on
Jul 15, 2024
Sold by
Riggs Eugene M and Kelly Rae
Bought by
Giraud Levi P and Giraud Danielle K
Current Estimated Value
Home Financials for this Owner
Home Financials are based on the most recent Mortgage that was taken out on this home.
Original Mortgage
$343,660
Outstanding Balance
$339,555
Interest Rate
6.99%
Mortgage Type
New Conventional
Estimated Equity
-$8,674
Purchase Details
Closed on
May 18, 2022
Sold by
Buriani and Chris
Bought by
Riggs Eugene Mark and Riggs Kelly Rae
Home Financials for this Owner
Home Financials are based on the most recent Mortgage that was taken out on this home.
Original Mortgage
$178,500
Interest Rate
5.3%
Mortgage Type
New Conventional
Purchase Details
Closed on
Mar 5, 2022
Sold by
Revocable Living Trust
Bought by
Buriani Cynthia
Create a Home Valuation Report for This Property
The Home Valuation Report is an in-depth analysis detailing your home's value as well as a comparison with similar homes in the area
Home Values in the Area
Average Home Value in this Area
Purchase History
| Date | Buyer | Sale Price | Title Company |
|---|---|---|---|
| Giraud Levi P | $350,000 | Stewart Title | |
| Riggs Eugene Mark | -- | Stewart Title | |
| Buriani Cynthia | -- | None Listed On Document |
Source: Public Records
Mortgage History
| Date | Status | Borrower | Loan Amount |
|---|---|---|---|
| Open | Giraud Levi P | $343,660 | |
| Previous Owner | Riggs Eugene Mark | $178,500 |
Source: Public Records
Tax History Compared to Growth
Tax History
| Year | Tax Paid | Tax Assessment Tax Assessment Total Assessment is a certain percentage of the fair market value that is determined by local assessors to be the total taxable value of land and additions on the property. | Land | Improvement |
|---|---|---|---|---|
| 2024 | $1,171 | $103,113 | $24,000 | $79,113 |
| 2023 | $1,254 | $89,125 | $10,500 | $78,625 |
| 2022 | $1,118 | $89,125 | $10,500 | $78,625 |
| 2021 | $1,165 | $89,125 | $10,500 | $78,625 |
| 2020 | $1,120 | $88,735 | $10,500 | $78,235 |
| 2019 | $892 | $83,590 | $20,000 | $63,590 |
| 2018 | $2,358 | $162,875 | $16,000 | $146,875 |
| 2017 | $1,904 | $140,280 | $16,000 | $124,280 |
| 2016 | $1,759 | $120,065 | $16,000 | $104,065 |
| 2013 | -- | $118,630 | $16,000 | $102,630 |
Source: Public Records
Map
Nearby Homes