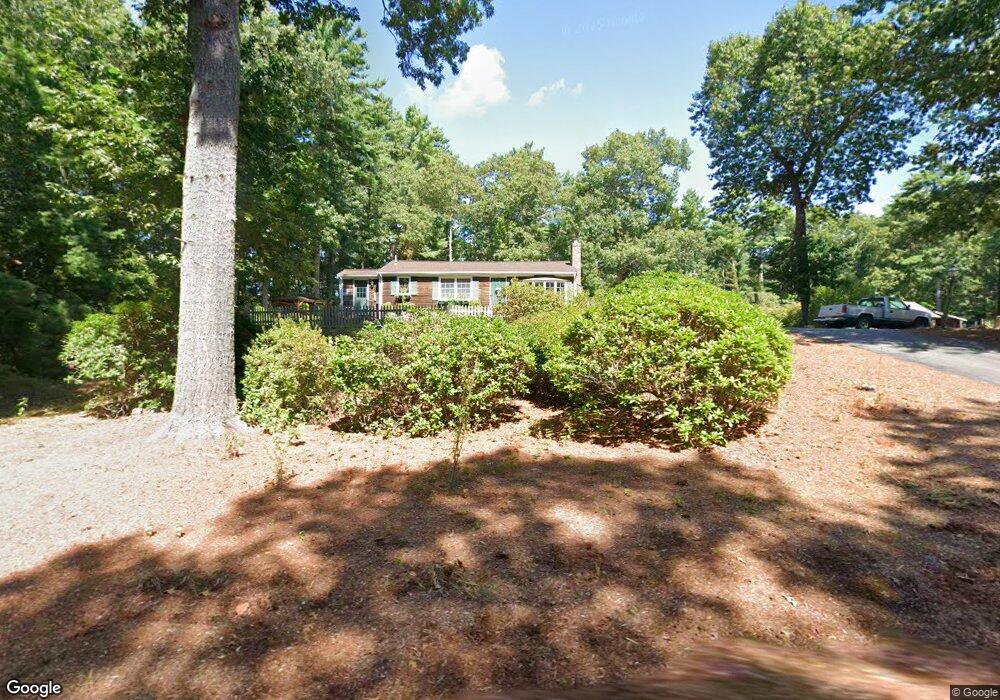
235 Cherry St Middleboro, MA 02346
Estimated Value: $376,000 - $471,006
3
Beds
1
Bath
950
Sq Ft
$458/Sq Ft
Est. Value
About This Home
This home is located at 235 Cherry St, Middleboro, MA 02346 and is currently estimated at $435,002, approximately $457 per square foot. 235 Cherry St is a home located in Plymouth County with nearby schools including Mary K. Goode Elementary School.
Ownership History
Date
Name
Owned For
Owner Type
Purchase Details
Closed on
May 7, 2025
Sold by
Meunier Deborah and Meunier Steven
Bought by
Meunier
Current Estimated Value
Purchase Details
Closed on
Mar 4, 2025
Sold by
Wilbur 2006 T and Wilbur Meunier
Bought by
Meunier Steven
Purchase Details
Closed on
Aug 4, 2016
Sold by
Wilbur Donald F and Wilbur Carol B
Bought by
Wilbur T T and Wilbur W
Purchase Details
Closed on
Aug 4, 2006
Sold by
Wilbur Donald F and Wilbur Carol B
Bought by
Wilbur Tr Donald F and Wilbur Carol B
Create a Home Valuation Report for This Property
The Home Valuation Report is an in-depth analysis detailing your home's value as well as a comparison with similar homes in the area
Home Values in the Area
Average Home Value in this Area
Purchase History
| Date | Buyer | Sale Price | Title Company |
|---|---|---|---|
| Meunier | -- | None Available | |
| Meunier | -- | None Available | |
| Meunier Steven | -- | None Available | |
| Meunier Steven | -- | None Available | |
| Wilbur T T | -- | -- | |
| Wilbur T T | -- | -- | |
| Wilbur Tr Donald F | -- | -- | |
| Wilbur Tr Donald F | -- | -- |
Source: Public Records
Mortgage History
| Date | Status | Borrower | Loan Amount |
|---|---|---|---|
| Previous Owner | Wilbur Tr Donald F | $70,000 |
Source: Public Records
Tax History
| Year | Tax Paid | Tax Assessment Tax Assessment Total Assessment is a certain percentage of the fair market value that is determined by local assessors to be the total taxable value of land and additions on the property. | Land | Improvement |
|---|---|---|---|---|
| 2025 | $5,246 | $391,200 | $164,100 | $227,100 |
| 2024 | $4,956 | $366,000 | $156,300 | $209,700 |
| 2023 | $4,668 | $327,800 | $156,300 | $171,500 |
| 2022 | $4,425 | $287,700 | $135,900 | $151,800 |
| 2021 | $4,313 | $265,100 | $119,100 | $146,000 |
| 2020 | $3,960 | $249,400 | $119,100 | $130,300 |
| 2019 | $3,742 | $241,700 | $119,100 | $122,600 |
| 2018 | $3,444 | $220,800 | $113,200 | $107,600 |
| 2017 | $3,380 | $214,300 | $108,900 | $105,400 |
| 2016 | $3,439 | $216,000 | $99,900 | $116,100 |
| 2015 | $3,203 | $203,000 | $99,900 | $103,100 |
Source: Public Records
Map
Nearby Homes
- 295 Cherry St
- 135 E Grove St
- 162 E Grove St
- 12 Basking Ridge
- 7 Tispaquin St
- 124 Ashley Ln Unit 12-4
- LOT A Wood St
- 80 Walnut St
- 13 Beverly's Way Unit 13
- 26 Susan Ln
- 17 Landing Way Unit 17
- 17 Cobblestone Ln
- 7 Bridge St
- 53 Miller St
- 15 E Grove St
- 80 Main St
- 167 Old Miller St
- 77 Main Street (Rte 105)
- 18 Rock St
- 6 Rock St
Your Personal Tour Guide
Ask me questions while you tour the home.