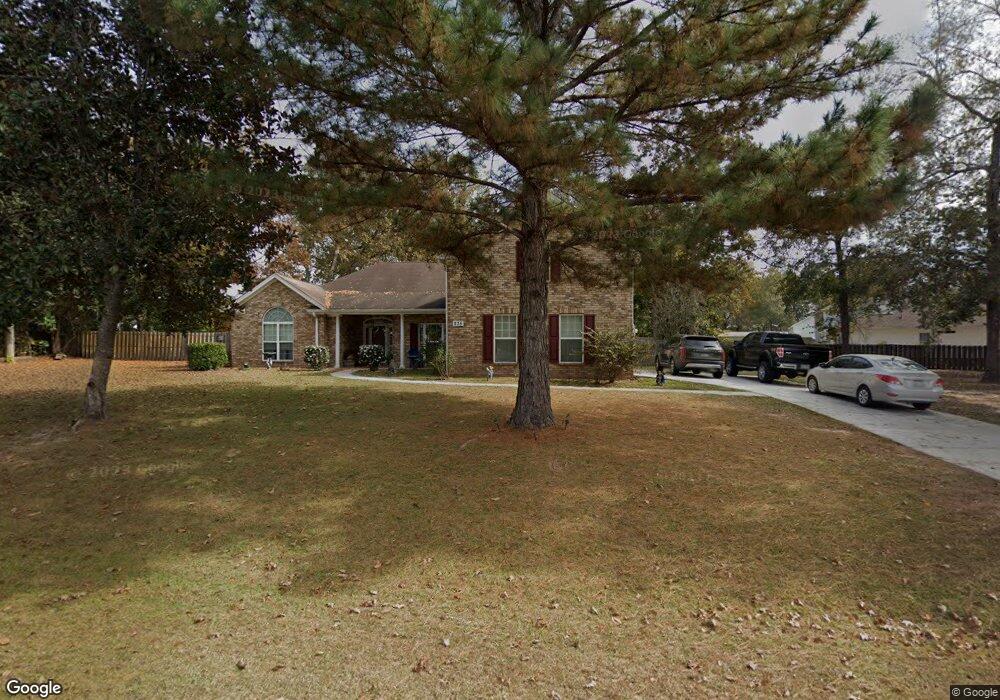
235 Creekside Cir Ellabell, GA 31308
Estimated Value: $366,000 - $372,000
5
Beds
3
Baths
2,986
Sq Ft
$124/Sq Ft
Est. Value
About This Home
This home is located at 235 Creekside Cir, Ellabell, GA 31308 and is currently estimated at $369,150, approximately $123 per square foot. 235 Creekside Cir is a home located in Bryan County with nearby schools including Lanier Primary School, Bryan County Elementary School, and Bryan County Middle School.
Ownership History
Date
Name
Owned For
Owner Type
Purchase Details
Closed on
Jul 17, 2020
Sold by
Martinez Juana
Bought by
Williams Juana Carrera and Williams Bobby M
Current Estimated Value
Purchase Details
Closed on
Dec 8, 2014
Sold by
Martinez Miguel A
Bought by
Martinez Juana
Purchase Details
Closed on
Jun 24, 2008
Sold by
Martinez Juana
Bought by
Martizez Juana
Purchase Details
Closed on
Oct 25, 2007
Sold by
Mainsail Construction Co I
Bought by
Martinez Juana
Purchase Details
Closed on
Jun 6, 2007
Sold by
Lewis Diana
Bought by
Lewis Diana and Lewis Jonathan J
Home Financials for this Owner
Home Financials are based on the most recent Mortgage that was taken out on this home.
Original Mortgage
$107,124
Interest Rate
9.75%
Mortgage Type
New Conventional
Purchase Details
Closed on
Jun 20, 2006
Bought by
Mainsail Construction Co Inc
Purchase Details
Closed on
Sep 6, 2005
Sold by
Blitch Roy F
Bought by
Minard Michael
Create a Home Valuation Report for This Property
The Home Valuation Report is an in-depth analysis detailing your home's value as well as a comparison with similar homes in the area
Home Values in the Area
Average Home Value in this Area
Purchase History
| Date | Buyer | Sale Price | Title Company |
|---|---|---|---|
| Williams Juana Carrera | -- | -- | |
| Martinez Juana | -- | -- | |
| Martizez Juana | -- | -- | |
| Martinez Juana | $250,025 | -- | |
| Lewis Diana | -- | -- | |
| Lewis Diana | $113,000 | -- | |
| Lewis Diana | $113,000 | -- | |
| Mainsail Construction Co Inc | $675,000 | -- | |
| Minard Michael | $21,500 | -- |
Source: Public Records
Mortgage History
| Date | Status | Borrower | Loan Amount |
|---|---|---|---|
| Previous Owner | Lewis Diana | $107,124 |
Source: Public Records
Tax History Compared to Growth
Tax History
| Year | Tax Paid | Tax Assessment Tax Assessment Total Assessment is a certain percentage of the fair market value that is determined by local assessors to be the total taxable value of land and additions on the property. | Land | Improvement |
|---|---|---|---|---|
| 2024 | $3,168 | $130,400 | $14,000 | $116,400 |
| 2023 | $3,168 | $108,600 | $14,000 | $94,600 |
| 2022 | $2,382 | $93,240 | $24,480 | $68,760 |
| 2021 | $2,239 | $85,840 | $14,000 | $71,840 |
| 2020 | $2,087 | $83,840 | $12,000 | $71,840 |
| 2019 | $2,143 | $80,760 | $10,800 | $69,960 |
| 2018 | $2,010 | $77,720 | $10,800 | $66,920 |
| 2017 | $1,914 | $78,600 | $10,800 | $67,800 |
| 2016 | $1,881 | $76,560 | $10,800 | $65,760 |
| 2015 | $1,855 | $75,200 | $10,800 | $64,400 |
| 2014 | $1,791 | $72,480 | $10,800 | $61,680 |
Source: Public Records
Map
Nearby Homes
- 285 Creekside Cir
- 105 Creekside Cir
- 310 Bonnie Cir
- 35 Oscar Ct
- 120 Bonnie Cir
- 35 Bonnie Cir
- 628 Toni Branch Rd
- 210 Zachary Trail
- 8 Palmetto Dr
- 0 Ga 204 Hwy Unit 328802
- 190 Freeman Dr
- 100 Hallelujah Trail
- 50 & 100 Hallelujah Trail
- 725 Blue Gill Rd
- 397 Pine Ridge Dr
- 335 Joshua Cir
- 410 Joshua Cir
- 58 Pine Ridge Ct
- 89 Wade Carter Rd
- 589 Old Mill Creek Rd
- 245 Creekside Cir
- 225 Creekside Cir
- 220 Creekside Cir
- 210 Creekside Cir
- 255 Creekside Cir
- 165 Creekside Cir
- 175 Creekside Cir
- 240 Creekside Cir
- 200 Creekside Cir
- 145 Creekside Cir
- 265 Creekside Cir
- 135 Creekside Cir
- 190 Creekside Cir
- 250 Creekside Cir
- 260 Creekside Cir
- 180 Creekside Cir
- 125 Creekside Cir
- 275 Creekside Cir
- 270 Creekside Cir
- 170 Creekside Cir