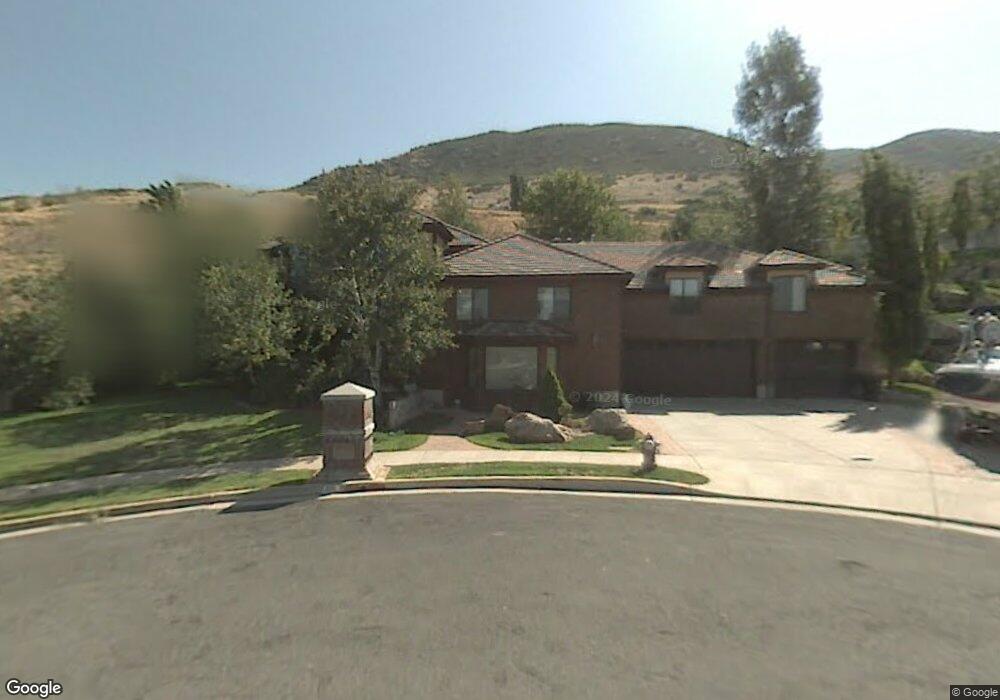
235 E 1875 N Centerville, UT 84014
Estimated Value: $961,000 - $1,062,000
6
Beds
4
Baths
5,398
Sq Ft
$185/Sq Ft
Est. Value
About This Home
This home is located at 235 E 1875 N, Centerville, UT 84014 and is currently estimated at $998,786, approximately $185 per square foot. 235 E 1875 N is a home located in Davis County with nearby schools including Reading School, Centerville Jr High, and Viewmont High School.
Ownership History
Date
Name
Owned For
Owner Type
Purchase Details
Closed on
May 18, 2020
Sold by
Vandimmelen Brad and Vandimmelen Jamie H
Bought by
Vandrimmelen Janile H and Vandrimmelen Brad
Current Estimated Value
Home Financials for this Owner
Home Financials are based on the most recent Mortgage that was taken out on this home.
Original Mortgage
$492,220
Outstanding Balance
$436,175
Interest Rate
3.3%
Mortgage Type
New Conventional
Estimated Equity
$562,611
Purchase Details
Closed on
Jul 25, 2019
Sold by
Stanger Kent W
Bought by
Vandrimmelen Brad and Vandrimmelen Jamie H
Home Financials for this Owner
Home Financials are based on the most recent Mortgage that was taken out on this home.
Original Mortgage
$484,350
Interest Rate
3.82%
Mortgage Type
New Conventional
Purchase Details
Closed on
Apr 23, 2019
Sold by
Stanger Wendy W
Bought by
Stanger Kent W
Create a Home Valuation Report for This Property
The Home Valuation Report is an in-depth analysis detailing your home's value as well as a comparison with similar homes in the area
Purchase History
| Date | Buyer | Sale Price | Title Company |
|---|---|---|---|
| Vandrimmelen Janile H | -- | First American Titl | |
| Vandrimmelen Brad | -- | Cottonwood Title | |
| Stanger Kent W | -- | None Available |
Source: Public Records
Mortgage History
| Date | Status | Borrower | Loan Amount |
|---|---|---|---|
| Open | Vandrimmelen Janile H | $492,220 | |
| Previous Owner | Vandrimmelen Brad | $484,350 |
Source: Public Records
Tax History
| Year | Tax Paid | Tax Assessment Tax Assessment Total Assessment is a certain percentage of the fair market value that is determined by local assessors to be the total taxable value of land and additions on the property. | Land | Improvement |
|---|---|---|---|---|
| 2025 | $5,231 | $464,750 | $195,897 | $268,853 |
| 2024 | $5,210 | $448,250 | $182,395 | $265,855 |
| 2023 | $5,143 | $806,000 | $290,866 | $515,134 |
| 2022 | $5,366 | $471,350 | $148,553 | $322,797 |
| 2021 | $4,594 | $633,000 | $236,331 | $396,669 |
| 2020 | $4,010 | $568,000 | $225,944 | $342,056 |
| 2019 | $3,956 | $550,000 | $210,753 | $339,247 |
| 2018 | $3,631 | $500,000 | $194,725 | $305,275 |
| 2016 | $3,170 | $244,750 | $74,490 | $170,260 |
| 2015 | $3,229 | $234,685 | $74,490 | $160,195 |
| 2014 | $3,082 | $232,975 | $74,238 | $158,737 |
| 2013 | -- | $218,861 | $53,133 | $165,728 |
Source: Public Records
Map
Nearby Homes
- 63 W 1750 N
- 145 Ford Canyon Dr
- 5 W Summerhill Ln
- 136 W Summerhill Ln
- 354 S 525 W
- 393 S 525 W
- 374 S 525 W
- 373 S 525 W
- 386 S 525 W
- 283 W Summerhill Ln
- 286 W Summerhill Ln
- 1549 N 400 W
- 586 W 1950 N
- 461 W Summerhill Ln
- 551 W Summerhill Ln
- 687 W 2025 N
- 2132 N 725 W
- 2136 N 725 W
- 1290 Oakridge Dr
- 2340 N 650 W
Your Personal Tour Guide
Ask me questions while you tour the home.