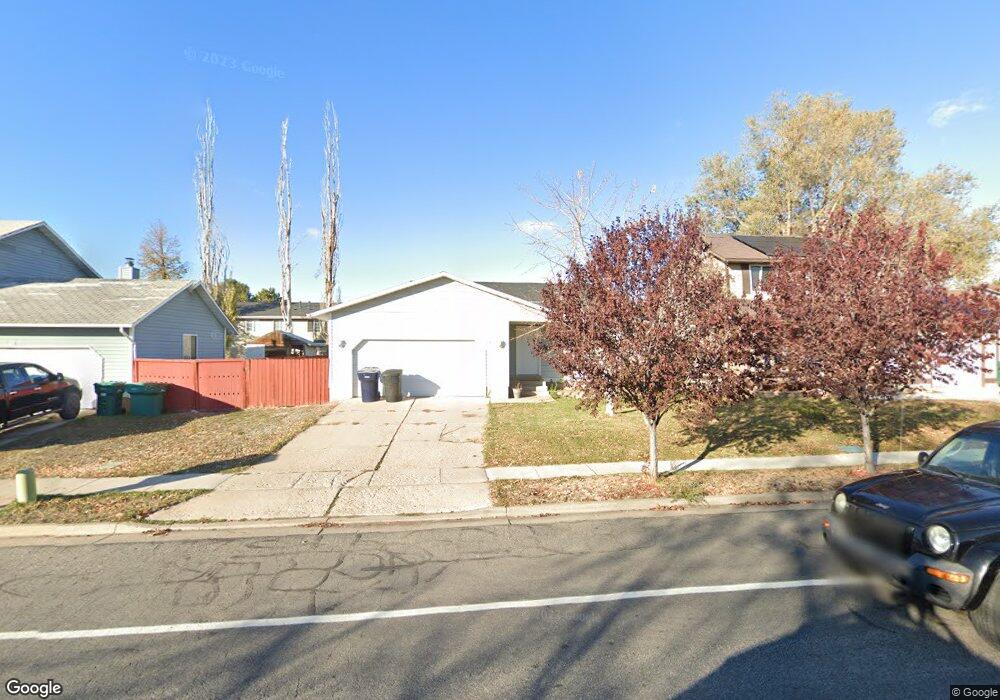
235 E 1900 S Clearfield, UT 84015
Estimated Value: $407,724 - $456,000
3
Beds
2
Baths
1,862
Sq Ft
$228/Sq Ft
Est. Value
About This Home
This home is located at 235 E 1900 S, Clearfield, UT 84015 and is currently estimated at $424,431, approximately $227 per square foot. 235 E 1900 S is a home located in Davis County with nearby schools including Antelope Elementary School, North Davis Junior High School, and Clearfield High School.
Ownership History
Date
Name
Owned For
Owner Type
Purchase Details
Closed on
Dec 11, 2020
Sold by
Legutzamon Angel
Bought by
Burns Alison and Peterson Nicholas
Current Estimated Value
Home Financials for this Owner
Home Financials are based on the most recent Mortgage that was taken out on this home.
Original Mortgage
$301,670
Outstanding Balance
$268,443
Interest Rate
2.8%
Mortgage Type
New Conventional
Estimated Equity
$155,988
Purchase Details
Closed on
Mar 17, 2016
Sold by
Martwick Daniel R
Bought by
Leguizamon Angel
Purchase Details
Closed on
Aug 26, 2009
Sold by
Roark John and Roark Ellen
Bought by
Hickman Colby D
Home Financials for this Owner
Home Financials are based on the most recent Mortgage that was taken out on this home.
Original Mortgage
$137,954
Interest Rate
5.09%
Mortgage Type
FHA
Purchase Details
Closed on
May 22, 2002
Sold by
Roark John
Bought by
Roark John and Roark Ellen
Create a Home Valuation Report for This Property
The Home Valuation Report is an in-depth analysis detailing your home's value as well as a comparison with similar homes in the area
Home Values in the Area
Average Home Value in this Area
Purchase History
| Date | Buyer | Sale Price | Title Company |
|---|---|---|---|
| Burns Alison | -- | Mountain View Tit | |
| Leguizamon Angel | -- | North American Title | |
| Hickman Colby D | -- | Inwest Title Services Inc | |
| Roark John | -- | Associated Title Company |
Source: Public Records
Mortgage History
| Date | Status | Borrower | Loan Amount |
|---|---|---|---|
| Open | Burns Alison | $301,670 | |
| Previous Owner | Hickman Colby D | $137,954 |
Source: Public Records
Tax History
| Year | Tax Paid | Tax Assessment Tax Assessment Total Assessment is a certain percentage of the fair market value that is determined by local assessors to be the total taxable value of land and additions on the property. | Land | Improvement |
|---|---|---|---|---|
| 2025 | $2,430 | $217,800 | $65,215 | $152,585 |
| 2024 | $2,358 | $212,850 | $62,396 | $150,454 |
| 2023 | $2,161 | $358,000 | $100,527 | $257,473 |
| 2022 | $2,345 | $210,100 | $58,237 | $151,863 |
| 2021 | $2,127 | $288,000 | $58,488 | $229,512 |
| 2020 | $1,934 | $260,000 | $48,575 | $211,425 |
| 2019 | $1,838 | $244,000 | $53,204 | $190,796 |
| 2018 | $1,763 | $228,000 | $47,224 | $180,776 |
| 2016 | $1,320 | $89,265 | $18,637 | $70,628 |
| 2015 | $1,210 | $77,990 | $18,637 | $59,353 |
| 2014 | $1,058 | $69,136 | $18,637 | $50,499 |
| 2013 | -- | $51,913 | $24,710 | $27,203 |
Source: Public Records
Map
Nearby Homes
- 460 E 1700 S Unit 1 & 2
- 1969 S 575 E
- 195 E 2325 S
- 1685 S 245 W
- 1877 S 725 E
- 2345 S Main St
- 1250 N 2925 W
- 369 W 1900 S
- 906 E Sam Cir
- 2480 S Main St
- 3250 W 1075 N
- 1870 N Celia Way
- 1186 N 2425 W
- 1916 N Celia Way
- 3389 W Gordon Ave
- 1876 W 1575 N Unit 237
- 1141 N 2275 W
- 1570 N 1875 W Unit 242
- 1570 N 1875 W
- 1740 N Gregory Dr
Your Personal Tour Guide
Ask me questions while you tour the home.