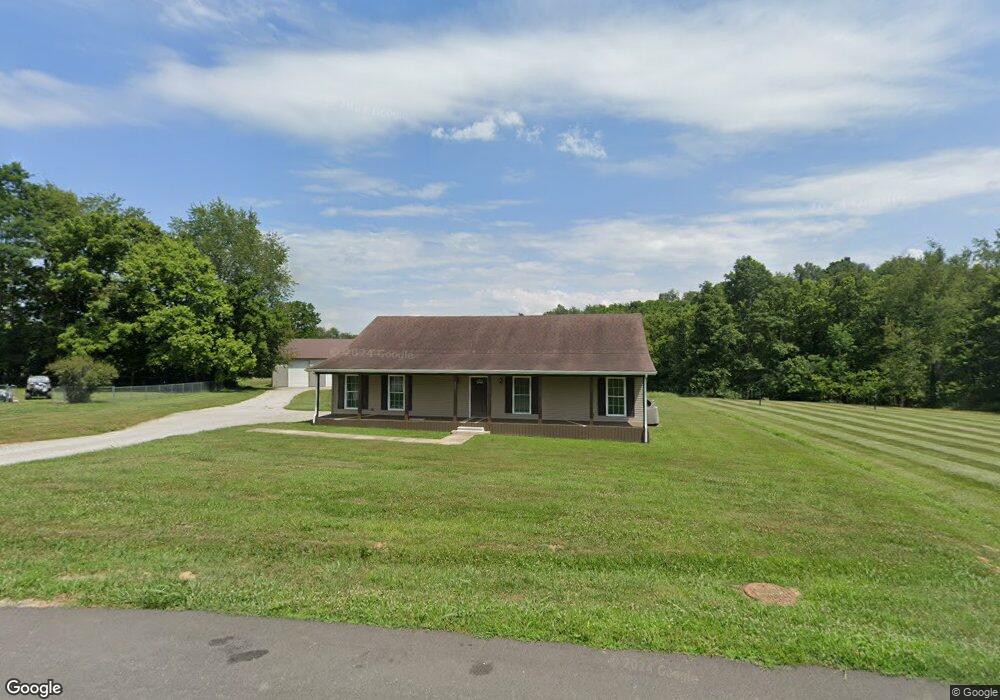
235 Elm Loop Hustonville, KY 40437
Estimated Value: $248,000 - $299,000
3
Beds
2
Baths
1,412
Sq Ft
$189/Sq Ft
Est. Value
About This Home
This home is located at 235 Elm Loop, Hustonville, KY 40437 and is currently estimated at $267,131, approximately $189 per square foot. 235 Elm Loop is a home with nearby schools including Lincoln County High School.
Ownership History
Date
Name
Owned For
Owner Type
Purchase Details
Closed on
Oct 21, 2015
Sold by
Griffin Elroy A and Griffin Patricia A
Bought by
Hale Danny M
Current Estimated Value
Purchase Details
Closed on
Mar 22, 2012
Sold by
Bluegrass Community Bank Inc
Bought by
Hale Danny M
Home Financials for this Owner
Home Financials are based on the most recent Mortgage that was taken out on this home.
Original Mortgage
$86,000
Interest Rate
3.97%
Mortgage Type
Purchase Money Mortgage
Create a Home Valuation Report for This Property
The Home Valuation Report is an in-depth analysis detailing your home's value as well as a comparison with similar homes in the area
Purchase History
| Date | Buyer | Sale Price | Title Company |
|---|---|---|---|
| Hale Danny M | $45,000 | None Available | |
| Hale Danny M | $116,000 | None Available |
Source: Public Records
Mortgage History
| Date | Status | Borrower | Loan Amount |
|---|---|---|---|
| Previous Owner | Hale Danny M | $86,000 |
Source: Public Records
Tax History
| Year | Tax Paid | Tax Assessment Tax Assessment Total Assessment is a certain percentage of the fair market value that is determined by local assessors to be the total taxable value of land and additions on the property. | Land | Improvement |
|---|---|---|---|---|
| 2025 | $2,073 | $202,000 | $40,000 | $162,000 |
| 2024 | $21 | $202,000 | $60,000 | $142,000 |
| 2023 | $2,095 | $202,000 | $60,000 | $142,000 |
| 2022 | $2,099 | $202,000 | $60,000 | $142,000 |
| 2021 | $1,924 | $181,000 | $0 | $0 |
| 2020 | $1,967 | $181,000 | $0 | $0 |
| 2019 | $1,988 | $181,000 | $0 | $0 |
| 2018 | $1,968 | $181,000 | $0 | $0 |
| 2017 | -- | $161,000 | $0 | $0 |
| 2016 | $1,720 | $161,000 | $0 | $0 |
| 2015 | $624 | $116,000 | $0 | $0 |
| 2012 | $624 | $116,000 | $19,000 | $97,000 |
Source: Public Records
Map
Nearby Homes
- 222 Elm Loop
- 5188 Us Highway 127
- 232 Griffin Ave
- 155 Amber Ln
- 85 Amber Ln
- 198 Amber Ln
- 216 Raintree Cir
- 168 Master Ct
- Lot 46 Griffin Ave
- 342 Masters Ct
- 6376 State Highway 1194
- 10 Nelson Dr
- 175 Robin Dr
- 32 Eastgate Rd
- 90 Greg Dr
- 195 Holtzclaw Ln
- 000 US Highway 127
- 4510 Kentucky 2141
- 103 Austin Dr
- 7800 Danville Pike
Your Personal Tour Guide
Ask me questions while you tour the home.