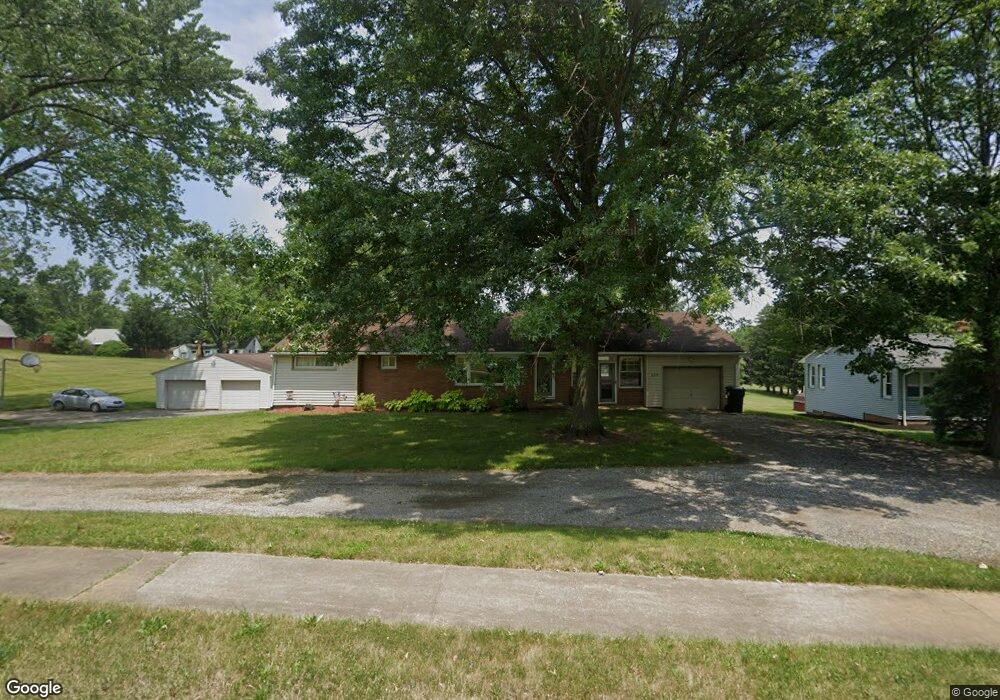
235 Faircrest St SW Canton, OH 44706
Estimated Value: $230,000 - $269,735
4
Beds
2
Baths
1,724
Sq Ft
$149/Sq Ft
Est. Value
About This Home
This home is located at 235 Faircrest St SW, Canton, OH 44706 and is currently estimated at $256,934, approximately $149 per square foot. 235 Faircrest St SW is a home located in Stark County with nearby schools including Faircrest Memorial Elementary School, Canton South High School, and Beacon Academy.
Ownership History
Date
Name
Owned For
Owner Type
Purchase Details
Closed on
Dec 29, 2014
Sold by
Crisp Jeffrey
Bought by
Crisp Mark R and Stewart Angela K
Current Estimated Value
Purchase Details
Closed on
Mar 6, 2002
Sold by
Crisp Karol
Bought by
Crisp Jeffrey
Home Financials for this Owner
Home Financials are based on the most recent Mortgage that was taken out on this home.
Original Mortgage
$128,700
Interest Rate
7.03%
Mortgage Type
Purchase Money Mortgage
Purchase Details
Closed on
Sep 29, 1995
Sold by
Crisp Yvonne K
Bought by
Crisp Jeffrey and Crisp Karol
Home Financials for this Owner
Home Financials are based on the most recent Mortgage that was taken out on this home.
Original Mortgage
$85,000
Interest Rate
8%
Mortgage Type
New Conventional
Purchase Details
Closed on
Dec 7, 1993
Create a Home Valuation Report for This Property
The Home Valuation Report is an in-depth analysis detailing your home's value as well as a comparison with similar homes in the area
Home Values in the Area
Average Home Value in this Area
Purchase History
| Date | Buyer | Sale Price | Title Company |
|---|---|---|---|
| Crisp Mark R | $135,000 | None Available | |
| Crisp Jeffrey | -- | -- | |
| Crisp Jeffrey | $110,000 | -- | |
| -- | -- | -- |
Source: Public Records
Mortgage History
| Date | Status | Borrower | Loan Amount |
|---|---|---|---|
| Closed | Crisp Jeffrey | $128,700 | |
| Closed | Crisp Jeffrey | $85,000 |
Source: Public Records
Tax History Compared to Growth
Tax History
| Year | Tax Paid | Tax Assessment Tax Assessment Total Assessment is a certain percentage of the fair market value that is determined by local assessors to be the total taxable value of land and additions on the property. | Land | Improvement |
|---|---|---|---|---|
| 2025 | -- | $92,510 | $25,060 | $67,450 |
| 2024 | -- | $92,510 | $25,060 | $67,450 |
| 2023 | $2,973 | $64,690 | $16,840 | $47,850 |
| 2022 | $2,751 | $64,690 | $16,840 | $47,850 |
| 2021 | $2,760 | $64,690 | $16,840 | $47,850 |
| 2020 | $2,665 | $54,670 | $14,280 | $40,390 |
| 2019 | $2,707 | $54,680 | $14,280 | $40,400 |
| 2018 | $2,685 | $54,680 | $14,280 | $40,400 |
| 2017 | $2,743 | $52,750 | $13,270 | $39,480 |
| 2016 | $2,752 | $52,750 | $13,270 | $39,480 |
| 2015 | $2,701 | $50,580 | $13,270 | $37,310 |
| 2014 | $513 | $44,040 | $11,550 | $32,490 |
| 2013 | $1,262 | $44,040 | $11,550 | $32,490 |
Source: Public Records
Map
Nearby Homes
- 223 Faircrest St SW
- 3939 Cleveland Ave SW
- 3673 Highview Ave SW
- 3641 Diane Ave SW
- 3415 Cleveland Ave SW
- 4624 Ridge Ave SE
- 236 32nd St SW
- 3245 Sierra Ave SW
- 4314 Millport Ave SW
- 5226 Ashmont Ave SW
- 1521 Bravado Rd SW
- 1550 Rebel St SW
- 900 53rd St SW
- 340 53rd St SW
- 4805 Harvest Cir SE
- 5327 Dunfred Cir SE
- 5346 Shaker Valley Cir SE
- 5333 Dunfred Cir SE
- 3223 Dueber Ave SW
- 1926 Village St SE
- 251 Faircrest St SW
- 9999 Faircrest St SW
- 226 40th St SW
- 244 Faircrest St SW
- 238 40th St SW
- 204 40th St SW
- 313 Faircrest St SW
- 205 Faircrest St SW
- 220 Faircrest St SW
- 320 40th St SW
- 176 40th St SW
- 306 Faircrest St SW
- 200 Faircrest St SW
- 183 Faircrest St SW
- 318 Faircrest St SW
- 221 40th St SW
- 325 Faircrest St SW
- 205 40th St SW
- 190 Faircrest St SW
- 301 40th St SW