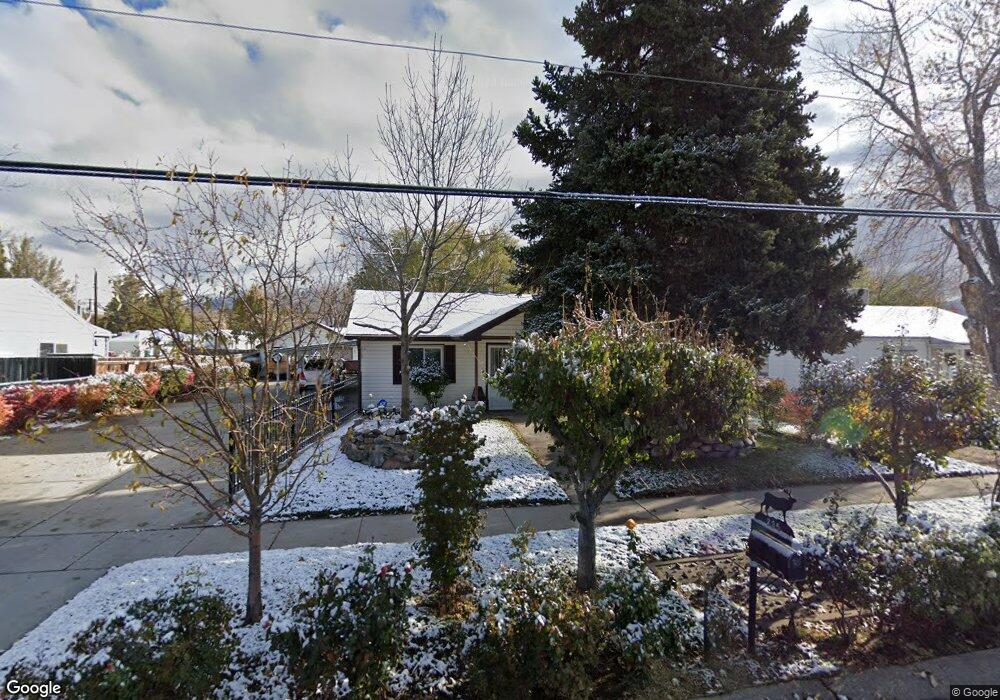
235 Flint St Layton, UT 84041
Estimated Value: $384,000 - $426,000
3
Beds
2
Baths
1,428
Sq Ft
$283/Sq Ft
Est. Value
About This Home
This home is located at 235 Flint St, Layton, UT 84041 and is currently estimated at $403,527, approximately $282 per square foot. 235 Flint St is a home located in Davis County with nearby schools including Layton Elementary School, Fairfield Junior High School, and Layton High School.
Ownership History
Date
Name
Owned For
Owner Type
Purchase Details
Closed on
Sep 28, 2022
Sold by
Ramirez Marjorie G
Bought by
Ramirez Marjorie G and Ramirez Nieves S
Current Estimated Value
Purchase Details
Closed on
Jan 27, 2016
Sold by
Ramirez Nieves S
Bought by
Ramirez Marjorie G
Purchase Details
Closed on
Dec 29, 1998
Sold by
Ramirez Nieves S and Ramirez Margarita J
Bought by
Gutierrez Marjorie G and Ramirez Gail C
Create a Home Valuation Report for This Property
The Home Valuation Report is an in-depth analysis detailing your home's value as well as a comparison with similar homes in the area
Home Values in the Area
Average Home Value in this Area
Purchase History
| Date | Buyer | Sale Price | Title Company |
|---|---|---|---|
| Ramirez Marjorie G | -- | Old Republic Title | |
| Ramirez Marjorie G | -- | Backman Title | |
| Gutierrez Marjorie G | -- | -- |
Source: Public Records
Tax History Compared to Growth
Tax History
| Year | Tax Paid | Tax Assessment Tax Assessment Total Assessment is a certain percentage of the fair market value that is determined by local assessors to be the total taxable value of land and additions on the property. | Land | Improvement |
|---|---|---|---|---|
| 2025 | $2,091 | $219,450 | $102,756 | $116,694 |
| 2024 | -- | $198,000 | $125,611 | $72,389 |
| 2023 | $1,803 | $336,000 | $125,669 | $210,331 |
| 2022 | $1,929 | $355,000 | $141,206 | $213,794 |
| 2021 | $1,524 | $230,000 | $116,514 | $113,486 |
| 2020 | $1,146 | $166,000 | $98,253 | $67,747 |
| 2019 | $1,163 | $165,000 | $100,366 | $64,634 |
| 2018 | $969 | $138,000 | $88,078 | $49,922 |
| 2016 | $848 | $62,315 | $34,829 | $27,486 |
| 2015 | $808 | $56,320 | $34,829 | $21,491 |
| 2014 | $823 | $58,671 | $34,829 | $23,842 |
| 2013 | -- | $72,446 | $20,680 | $51,766 |
Source: Public Records
Map
Nearby Homes