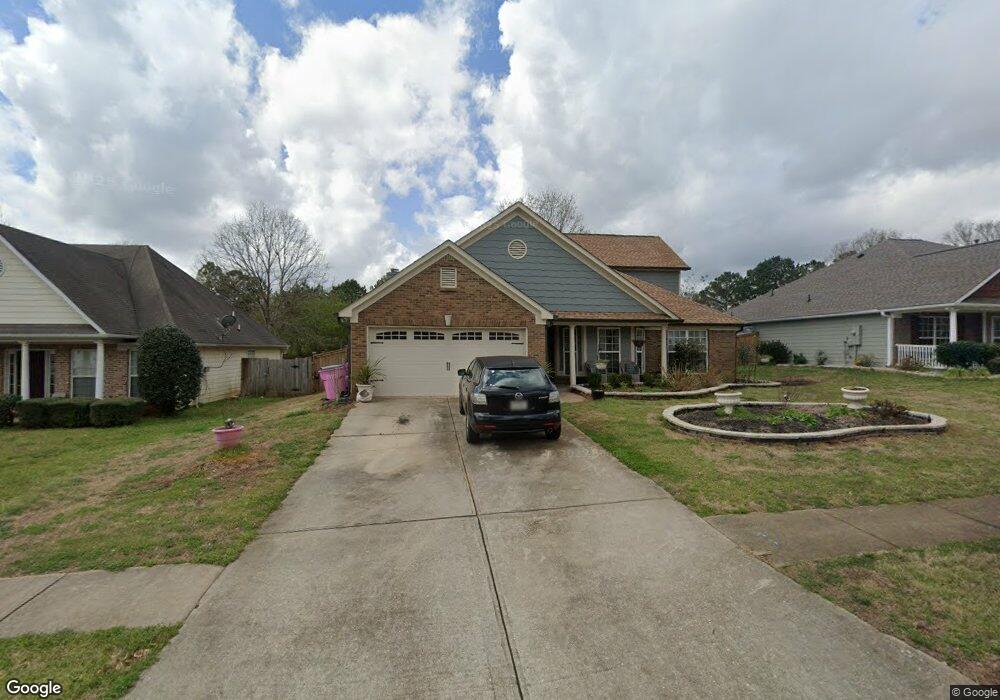
235 Gilliam Ct Locust Grove, GA 30248
Estimated Value: $324,000 - $357,000
4
Beds
3
Baths
2,675
Sq Ft
$127/Sq Ft
Est. Value
About This Home
This home is located at 235 Gilliam Ct, Locust Grove, GA 30248 and is currently estimated at $340,485, approximately $127 per square foot. 235 Gilliam Ct is a home located in Henry County with nearby schools including Bethlehem Elementary School, Luella Middle School, and Luella High School.
Ownership History
Date
Name
Owned For
Owner Type
Purchase Details
Closed on
Mar 12, 2018
Sold by
Hogan Sandra
Bought by
Clay Dorothy and Vizcaino Pedro
Current Estimated Value
Home Financials for this Owner
Home Financials are based on the most recent Mortgage that was taken out on this home.
Original Mortgage
$176,641
Outstanding Balance
$153,924
Interest Rate
5.12%
Mortgage Type
FHA
Estimated Equity
$186,561
Purchase Details
Closed on
Aug 27, 2011
Sold by
Hogan Kevin
Bought by
Hogan Sandra
Purchase Details
Closed on
Oct 31, 2008
Sold by
Tankersley Wayne and Tankersley Lori
Bought by
Hogan Kevin
Purchase Details
Closed on
May 21, 2004
Sold by
Parkview South Builders Inc
Bought by
Tankersley Wayne and Tankersley Lori
Home Financials for this Owner
Home Financials are based on the most recent Mortgage that was taken out on this home.
Original Mortgage
$184,852
Interest Rate
6.25%
Mortgage Type
VA
Create a Home Valuation Report for This Property
The Home Valuation Report is an in-depth analysis detailing your home's value as well as a comparison with similar homes in the area
Home Values in the Area
Average Home Value in this Area
Purchase History
| Date | Buyer | Sale Price | Title Company |
|---|---|---|---|
| Clay Dorothy | $179,900 | -- | |
| Hogan Sandra | -- | -- | |
| Hogan Kevin | $159,900 | -- | |
| Tankersley Wayne | $186,400 | -- |
Source: Public Records
Mortgage History
| Date | Status | Borrower | Loan Amount |
|---|---|---|---|
| Open | Clay Dorothy | $176,641 | |
| Previous Owner | Tankersley Wayne | $184,852 |
Source: Public Records
Tax History Compared to Growth
Tax History
| Year | Tax Paid | Tax Assessment Tax Assessment Total Assessment is a certain percentage of the fair market value that is determined by local assessors to be the total taxable value of land and additions on the property. | Land | Improvement |
|---|---|---|---|---|
| 2025 | $4,175 | $134,760 | $16,000 | $118,760 |
| 2024 | $4,175 | $135,360 | $16,000 | $119,360 |
| 2023 | $3,770 | $137,320 | $14,800 | $122,520 |
| 2022 | $3,833 | $118,600 | $14,800 | $103,800 |
| 2021 | $3,116 | $88,240 | $14,800 | $73,440 |
| 2020 | $3,276 | $83,560 | $10,000 | $73,560 |
| 2019 | $2,831 | $71,960 | $9,643 | $62,317 |
| 2018 | $2,730 | $69,320 | $8,000 | $61,320 |
| 2016 | $2,590 | $65,680 | $8,000 | $57,680 |
| 2015 | $2,490 | $61,160 | $8,000 | $53,160 |
| 2014 | $2,499 | $60,680 | $8,000 | $52,680 |
Source: Public Records
Map
Nearby Homes
- 512 Vickers Ln
- 640 Howell Dr
- 412 Eglington Trail
- 1220 Nottley Dr
- 112 Leveret Rd
- 633 Jervis Way
- 115 N Chesapeake Bay Dr
- 1429 Kentmire Ct
- 119 Bantry Way
- 1360 Luella Rd
- 214 Georgian Way
- 2336 Mcintosh Dr
- 1171 Bodega Loop
- 2356 Mcintosh Dr
- 1913 Avondale Ct
- 2439 Mcintosh Dr
- 271 Trestle Rd
- 1729 Cadence St
- 5001 Wolverine Place
- 3157 Highway 155
- 231 Gilliam Ct
- 243 Gilliam Ct
- 227 Gilliam Ct
- 247 Gilliam Ct
- 232 Gilliam Ct
- 236 Gilliam Ct
- 400 Mazley Dr
- 240 Gilliam Ct
- 223 Lantana Dr
- 223 Lantana Dr Unit 13
- 231 Lantana Dr
- 251 Gilliam Ct
- 244 Gilliam Ct
- 219 Gilliam Ct
- 219 Lantana Dr
- 235 Lantana Dr
- 404 Mazley Dr
- 248 Gilliam Ct
- 215 Lantana Dr
- 255 Gilliam Ct