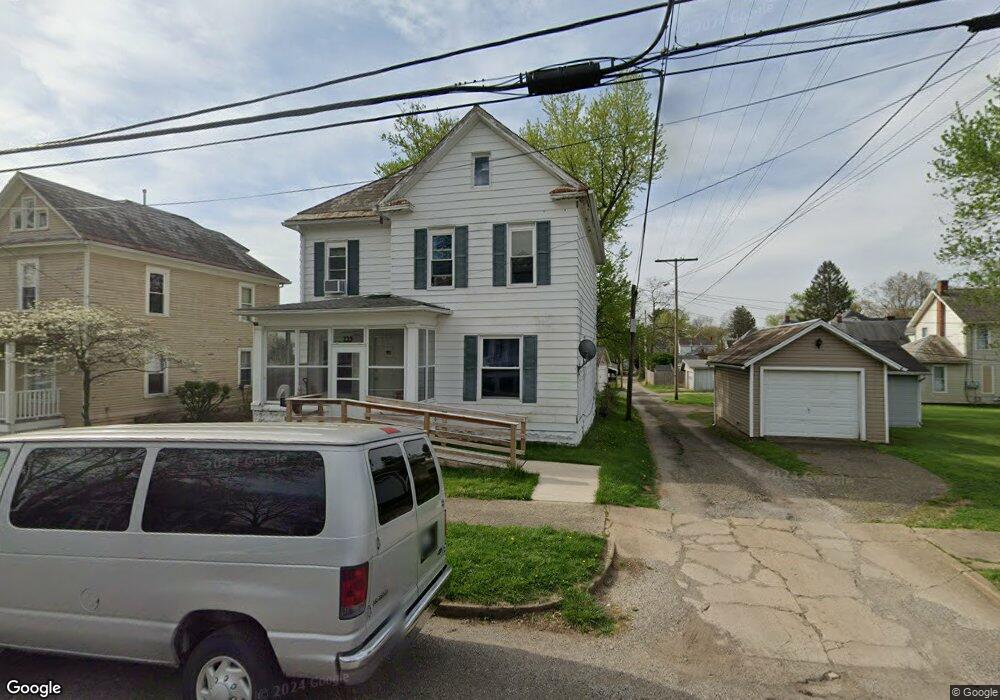
235 Hoover St Newark, OH 43055
Estimated Value: $174,000 - $209,000
3
Beds
2
Baths
1,424
Sq Ft
$135/Sq Ft
Est. Value
About This Home
This home is located at 235 Hoover St, Newark, OH 43055 and is currently estimated at $192,555, approximately $135 per square foot. 235 Hoover St is a home located in Licking County with nearby schools including John Clem Elementary School, Liberty Middle School, and Newark High School.
Ownership History
Date
Name
Owned For
Owner Type
Purchase Details
Closed on
Apr 19, 2007
Sold by
Barnes Richard L
Bought by
Rowlee Jason J and Rowlee Tristan D
Current Estimated Value
Home Financials for this Owner
Home Financials are based on the most recent Mortgage that was taken out on this home.
Original Mortgage
$84,948
Outstanding Balance
$51,475
Interest Rate
6.19%
Mortgage Type
Unknown
Estimated Equity
$141,080
Purchase Details
Closed on
Jan 17, 2007
Sold by
Jpmorgan Chase Bank
Bought by
Barnes Richard L
Purchase Details
Closed on
Oct 24, 2005
Sold by
Picard Louis C and Picard Debra L
Bought by
Jpmorgan Chase Bank
Purchase Details
Closed on
Feb 24, 2000
Sold by
Cullins Donna A
Bought by
B & D Donaldson Ltd
Home Financials for this Owner
Home Financials are based on the most recent Mortgage that was taken out on this home.
Original Mortgage
$60,000
Interest Rate
8.21%
Mortgage Type
New Conventional
Create a Home Valuation Report for This Property
The Home Valuation Report is an in-depth analysis detailing your home's value as well as a comparison with similar homes in the area
Home Values in the Area
Average Home Value in this Area
Purchase History
| Date | Buyer | Sale Price | Title Company |
|---|---|---|---|
| Rowlee Jason J | $83,500 | Attorney | |
| Barnes Richard L | $46,400 | Resourc | |
| Jpmorgan Chase Bank | $55,000 | None Available | |
| B & D Donaldson Ltd | $60,000 | -- |
Source: Public Records
Mortgage History
| Date | Status | Borrower | Loan Amount |
|---|---|---|---|
| Open | Rowlee Jason J | $84,948 | |
| Previous Owner | B & D Donaldson Ltd | $60,000 |
Source: Public Records
Tax History
| Year | Tax Paid | Tax Assessment Tax Assessment Total Assessment is a certain percentage of the fair market value that is determined by local assessors to be the total taxable value of land and additions on the property. | Land | Improvement |
|---|---|---|---|---|
| 2024 | $1,634 | $45,680 | $11,030 | $34,650 |
| 2023 | $1,631 | $45,680 | $11,030 | $34,650 |
| 2022 | $1,379 | $34,340 | $6,230 | $28,110 |
| 2021 | $1,446 | $34,340 | $6,230 | $28,110 |
| 2020 | $1,480 | $34,340 | $6,230 | $28,110 |
| 2019 | $1,200 | $26,810 | $5,180 | $21,630 |
| 2018 | $1,201 | $0 | $0 | $0 |
| 2017 | $1,150 | $0 | $0 | $0 |
| 2016 | $1,303 | $0 | $0 | $0 |
| 2015 | $1,331 | $0 | $0 | $0 |
| 2014 | $1,705 | $0 | $0 | $0 |
| 2013 | $1,329 | $0 | $0 | $0 |
Source: Public Records
Map
Nearby Homes
- 218 Granville St
- 185 N 10th St
- 293 Merchant St
- 355 Eddy St
- 207 Buckingham St
- 361 Granville St
- 385 Woods Ave
- 210 Buckingham St
- 99 Hoover St
- 69 Wallace St
- 122 W Shields St
- 377 Saint James Gate
- 191 Elmwood Ave
- 441 Mount Vernon Rd
- 27 W North St
- 242 Hudson Ave
- 12 E Saint Clair St
- 214-218 Hudson Ave
- 476 W Shields St
- 311 Clinton St
Your Personal Tour Guide
Ask me questions while you tour the home.