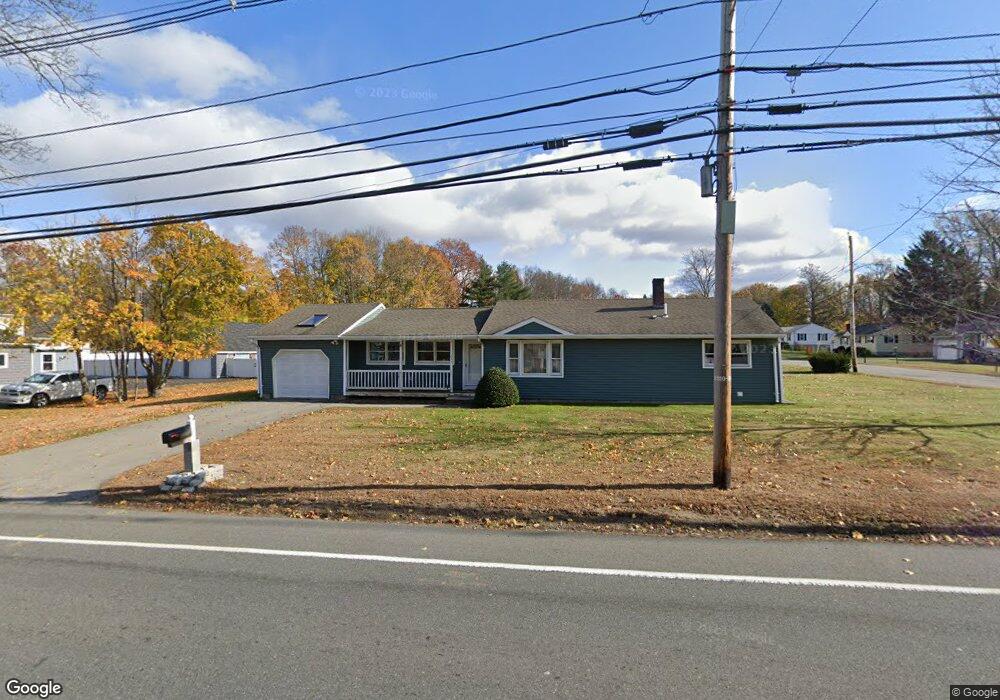
235 Howe St Methuen, MA 01844
The North End NeighborhoodEstimated Value: $546,715 - $601,000
3
Beds
1
Bath
1,288
Sq Ft
$448/Sq Ft
Est. Value
About This Home
This home is located at 235 Howe St, Methuen, MA 01844 and is currently estimated at $576,929, approximately $447 per square foot. 235 Howe St is a home located in Essex County with nearby schools including Methuen High School and Saint Monica School.
Ownership History
Date
Name
Owned For
Owner Type
Purchase Details
Closed on
May 15, 2023
Sold by
Bergeron Mary L
Bought by
Bergeron 2023 T and Bergeron B
Current Estimated Value
Purchase Details
Closed on
Jun 15, 1990
Sold by
Bergeron Kenneth
Bought by
Bergeron Mary L
Home Financials for this Owner
Home Financials are based on the most recent Mortgage that was taken out on this home.
Original Mortgage
$80,000
Interest Rate
10.54%
Mortgage Type
Purchase Money Mortgage
Create a Home Valuation Report for This Property
The Home Valuation Report is an in-depth analysis detailing your home's value as well as a comparison with similar homes in the area
Home Values in the Area
Average Home Value in this Area
Purchase History
| Date | Buyer | Sale Price | Title Company |
|---|---|---|---|
| Bergeron 2023 T | -- | None Available | |
| Bergeron 2023 T | -- | None Available | |
| Bergeron 2023 T | -- | None Available | |
| Bergeron Mary L | $25,000 | -- |
Source: Public Records
Mortgage History
| Date | Status | Borrower | Loan Amount |
|---|---|---|---|
| Previous Owner | Bergeron Mary L | $80,000 |
Source: Public Records
Tax History
| Year | Tax Paid | Tax Assessment Tax Assessment Total Assessment is a certain percentage of the fair market value that is determined by local assessors to be the total taxable value of land and additions on the property. | Land | Improvement |
|---|---|---|---|---|
| 2025 | $5,018 | $474,300 | $215,100 | $259,200 |
| 2024 | $4,857 | $447,200 | $188,000 | $259,200 |
| 2023 | $4,582 | $391,600 | $165,400 | $226,200 |
| 2022 | $4,368 | $334,700 | $135,400 | $199,300 |
| 2021 | $4,084 | $309,600 | $127,800 | $181,800 |
| 2020 | $3,975 | $302,900 | $127,800 | $175,100 |
| 2019 | $3,875 | $273,100 | $120,300 | $152,800 |
| 2018 | $3,676 | $257,600 | $112,800 | $144,800 |
| 2017 | $3,557 | $242,800 | $112,800 | $130,000 |
| 2016 | $3,386 | $228,600 | $105,300 | $123,300 |
| 2015 | $3,222 | $220,700 | $105,300 | $115,400 |
Source: Public Records
Map
Nearby Homes
- 18 Argilla Rd
- 7 Tree Top Way
- 3 Adams Ave
- 34 Sable Run Ln
- 28 Currier Ave
- 64-66 Howe St
- 21 Huntington Ave
- 11 Brookside Ct
- Lot 108 Garden City Rd
- 40 Phoebe St Unit 101
- 127 Phoebe St Unit 127
- 125 Phoebe St Unit 125
- 64 Pine Tree Dr Unit 64
- 22 Tyler St
- 37 Iris Ave
- 687 Jackson St
- 27 Cole St
- 128 Pleasant Valley St
- 20 Colonial Dr
- 133 Pleasant Valley St
Your Personal Tour Guide
Ask me questions while you tour the home.