
Landlord's Agent in 2022
Mona Chahine
Coldwell Banker Realty - Westwood
(781) 856-4888
20 Total Sales
Estimated Value: $981,396 - $1,312,000
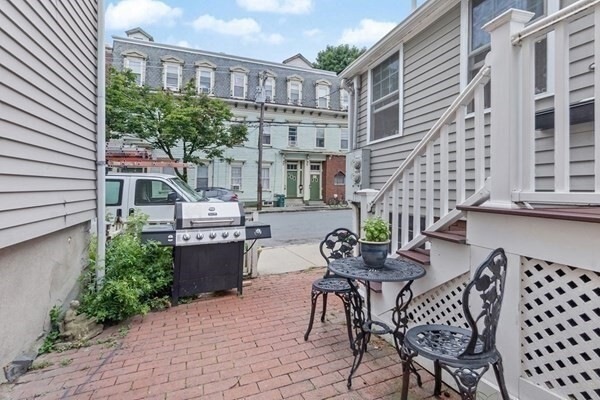
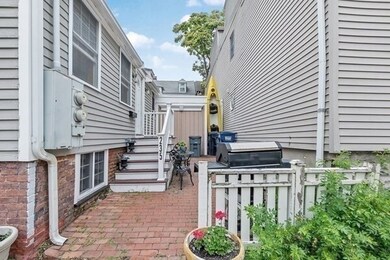
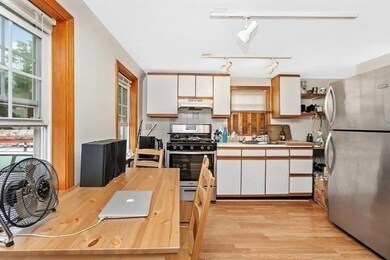
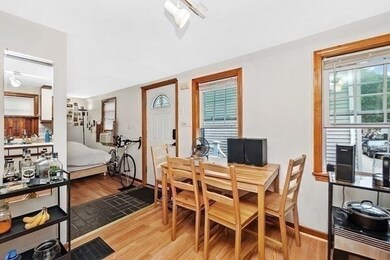
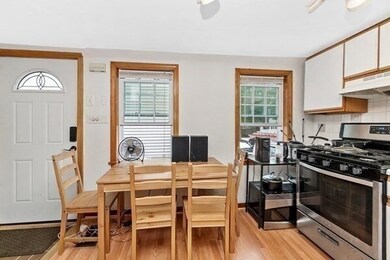
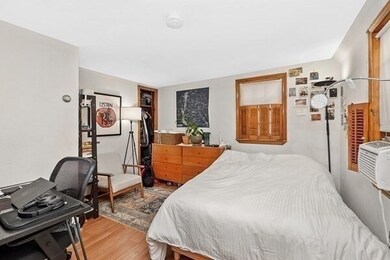
Sunny & spacious studio/ one bedroom unit with private patio to enjoy the outdoors life in the city. Kitchen with stainless appliances and pet friendly unit located in East Cambridge close to Lechmere & Kendall Square MBTA , Green & Red line, Galleria Mall, MIT, Harvard Square, restaurants and short distance to Charles River and everything Cambridge can offer. Cold water and sewer are included in the rent. Tenant to be responsible for all the other utilities. Good credit and proof of income are a MUST.Each applicant over the age of 18 years MUST apply on NTN for credit check. The $25 non refundable fee for each applicant. Group showings Friday June3rd 5:30 to 6:30pm Appointment required.
Last Agent to Rent the Property
Coldwell Banker Realty - Westwood Listed on: 05/24/2022
| Date | Buyer | Sale Price | Title Company |
|---|---|---|---|
| Cook George J | $80,000 | -- |
| Date | Status | Borrower | Loan Amount |
|---|---|---|---|
| Closed | Cook George J | $45,000 |
| Date | Event | Price | List to Sale | Price per Sq Ft |
|---|---|---|---|---|
| 07/01/2022 07/01/22 | Rented | $1,800 | +12.5% | -- |
| 06/16/2022 06/16/22 | Under Contract | -- | -- | -- |
| 05/24/2022 05/24/22 | For Rent | $1,600 | +6.7% | -- |
| 05/25/2021 05/25/21 | Rented | $1,500 | 0.0% | -- |
| 05/24/2021 05/24/21 | Under Contract | -- | -- | -- |
| 05/19/2021 05/19/21 | For Rent | $1,500 | -- | -- |
| Year | Tax Paid | Tax Assessment Tax Assessment Total Assessment is a certain percentage of the fair market value that is determined by local assessors to be the total taxable value of land and additions on the property. | Land | Improvement |
|---|---|---|---|---|
| 2025 | $6,746 | $1,062,400 | $574,500 | $487,900 |
| 2024 | $6,473 | $1,093,400 | $623,800 | $469,600 |
| 2023 | $5,904 | $1,007,500 | $595,600 | $411,900 |
| 2022 | $5,755 | $972,100 | $608,500 | $363,600 |
| 2021 | $13,527 | $938,900 | $597,100 | $341,800 |
| 2020 | $5,394 | $938,000 | $602,700 | $335,300 |
| 2019 | $5,364 | $903,000 | $591,200 | $311,800 |
| 2018 | $2,832 | $779,000 | $490,200 | $288,800 |
| 2017 | $4,598 | $708,500 | $438,300 | $270,200 |
| 2016 | $4,154 | $594,300 | $343,200 | $251,100 |
| 2015 | $4,040 | $516,600 | $294,100 | $222,500 |
| 2014 | $3,575 | $426,600 | $227,800 | $198,800 |
Landlord's Agent in 2022
Mona Chahine
Coldwell Banker Realty - Westwood
(781) 856-4888
20 Total Sales
B
Tenant's Agent in 2022
Bradford Guillory
Bradford & Associates R.E.
(617) 281-0793
7 Total Sales
Seller's Agent in 2021
Joe Elias
Keller Williams Realty Boston South West
(617) 633-0347
8 Total Sales
Source: MLS Property Information Network (MLS PIN)
MLS Number: 72986608
APN: CAMB-000024-000000-000136
Disclaimer: Certain information contained herein is derived from information provided by parties other than Homes.com. All information provided is deemed reliable, but is not guaranteed to be accurate and should be independently verified.
![]() The property listing data and information, or the Images, set forth herein were provided to MLS Property Information Network, Inc. from third party sources, including sellers, lessors and public records, and were compiled by MLS Property Information Network, Inc. The property listing data and information, and the Images, are for the personal, non-commercial use of consumers having a good faith interest in purchasing or leasing listed properties of the type displayed to them and may not be used for any purpose other than to identify prospective properties which such consumers may have a good faith interest in purchasing or leasing. MLS Property Information Network, Inc. and its subscribers disclaim any and all representations and warranties as to the accuracy of the property listing data and information, or as to the accuracy of any of the Images, set forth herein.
The property listing data and information, or the Images, set forth herein were provided to MLS Property Information Network, Inc. from third party sources, including sellers, lessors and public records, and were compiled by MLS Property Information Network, Inc. The property listing data and information, and the Images, are for the personal, non-commercial use of consumers having a good faith interest in purchasing or leasing listed properties of the type displayed to them and may not be used for any purpose other than to identify prospective properties which such consumers may have a good faith interest in purchasing or leasing. MLS Property Information Network, Inc. and its subscribers disclaim any and all representations and warranties as to the accuracy of the property listing data and information, or as to the accuracy of any of the Images, set forth herein.