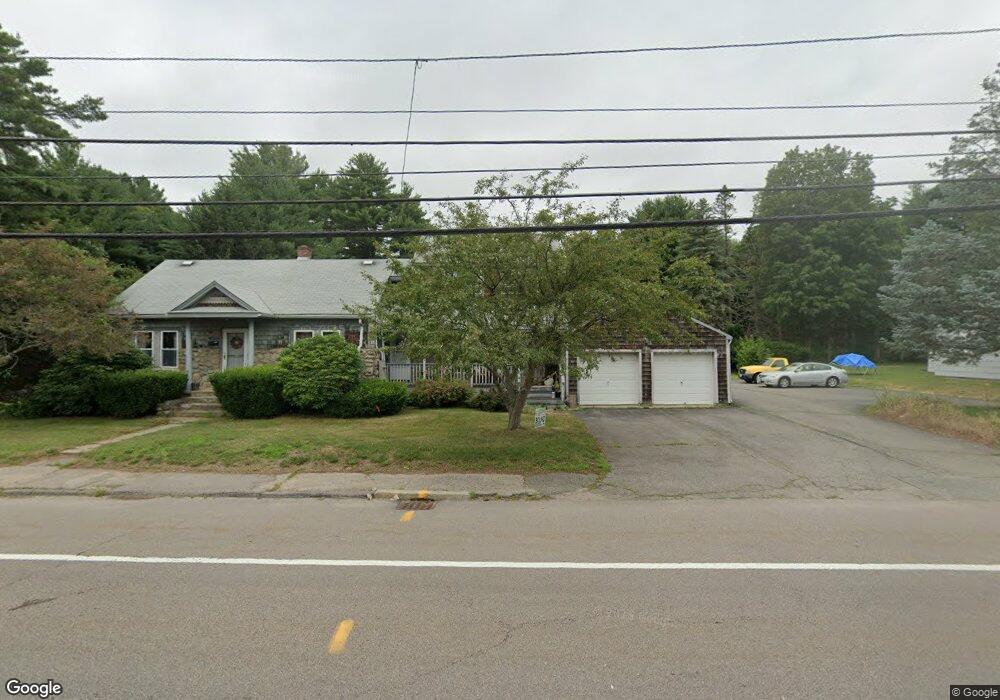
235 Main St Foxboro, MA 02035
Estimated Value: $818,000 - $1,102,000
3
Beds
2
Baths
2,842
Sq Ft
$329/Sq Ft
Est. Value
About This Home
This home is located at 235 Main St, Foxboro, MA 02035 and is currently estimated at $935,441, approximately $329 per square foot. 235 Main St is a home located in Norfolk County with nearby schools including Foxborough High School, Foxborough Regional Charter School, and The Sage School.
Ownership History
Date
Name
Owned For
Owner Type
Purchase Details
Closed on
Nov 2, 2022
Sold by
Bonin Vicki M
Bought by
Vicki M Bonin Ft 2022
Current Estimated Value
Purchase Details
Closed on
Jun 18, 1996
Sold by
Ohio Natl Life Ins
Bought by
Bonin Arthur H
Purchase Details
Closed on
Dec 31, 1990
Sold by
Decelle David H
Bought by
Sutherlin Michael K
Create a Home Valuation Report for This Property
The Home Valuation Report is an in-depth analysis detailing your home's value as well as a comparison with similar homes in the area
Home Values in the Area
Average Home Value in this Area
Purchase History
| Date | Buyer | Sale Price | Title Company |
|---|---|---|---|
| Vicki M Bonin Ft 2022 | -- | None Available | |
| Bonin Arthur H | $142,500 | -- | |
| Sutherlin Michael K | $143,750 | -- |
Source: Public Records
Mortgage History
| Date | Status | Borrower | Loan Amount |
|---|---|---|---|
| Previous Owner | Sutherlin Michael K | $206,400 | |
| Previous Owner | Sutherlin Michael K | $50,000 | |
| Previous Owner | Sutherlin Michael K | $125,000 |
Source: Public Records
Tax History
| Year | Tax Paid | Tax Assessment Tax Assessment Total Assessment is a certain percentage of the fair market value that is determined by local assessors to be the total taxable value of land and additions on the property. | Land | Improvement |
|---|---|---|---|---|
| 2025 | $10,156 | $768,200 | $253,300 | $514,900 |
| 2024 | $10,057 | $744,400 | $270,000 | $474,400 |
| 2023 | $9,768 | $687,400 | $258,000 | $429,400 |
| 2022 | $9,638 | $663,800 | $233,100 | $430,700 |
| 2021 | $9,506 | $644,900 | $222,200 | $422,700 |
| 2020 | $9,396 | $644,900 | $222,200 | $422,700 |
| 2019 | $9,286 | $631,700 | $222,700 | $409,000 |
| 2018 | $8,429 | $578,500 | $212,400 | $366,100 |
| 2017 | $8,007 | $532,400 | $209,100 | $323,300 |
| 2016 | $7,841 | $529,100 | $202,000 | $327,100 |
| 2015 | $7,636 | $502,700 | $154,500 | $348,200 |
| 2014 | $9,285 | $619,400 | $154,500 | $464,900 |
Source: Public Records
Map
Nearby Homes
- 8 Conway Ln
- 5 Post Rd
- 131 Washington St Unit 42
- 131 Washington St Unit 50
- 65 Foxboro Rd
- 75 Foxboro Rd
- 25 Foxboro Rd
- 7 Hill St Unit 12
- 7 Hill St Unit 16
- 54 Main St Unit A
- 14 Baker St
- 260 Summer St
- 576 Dedham St
- 9 Sharon Ave
- 11 Sharon Ave
- 73 Ridge Rd
- 67 Carpenter St
- 30 Weber Farm Rd Unit 30
- 8 Weber Farm Rd Unit 8
- 11 Weber Farm Rd Unit 11
Your Personal Tour Guide
Ask me questions while you tour the home.